

Share of eating-out expenditures at limited-service places more than tripled during the past half century
- by Annette Clauson and Howard Elitzak
- 12/23/2015
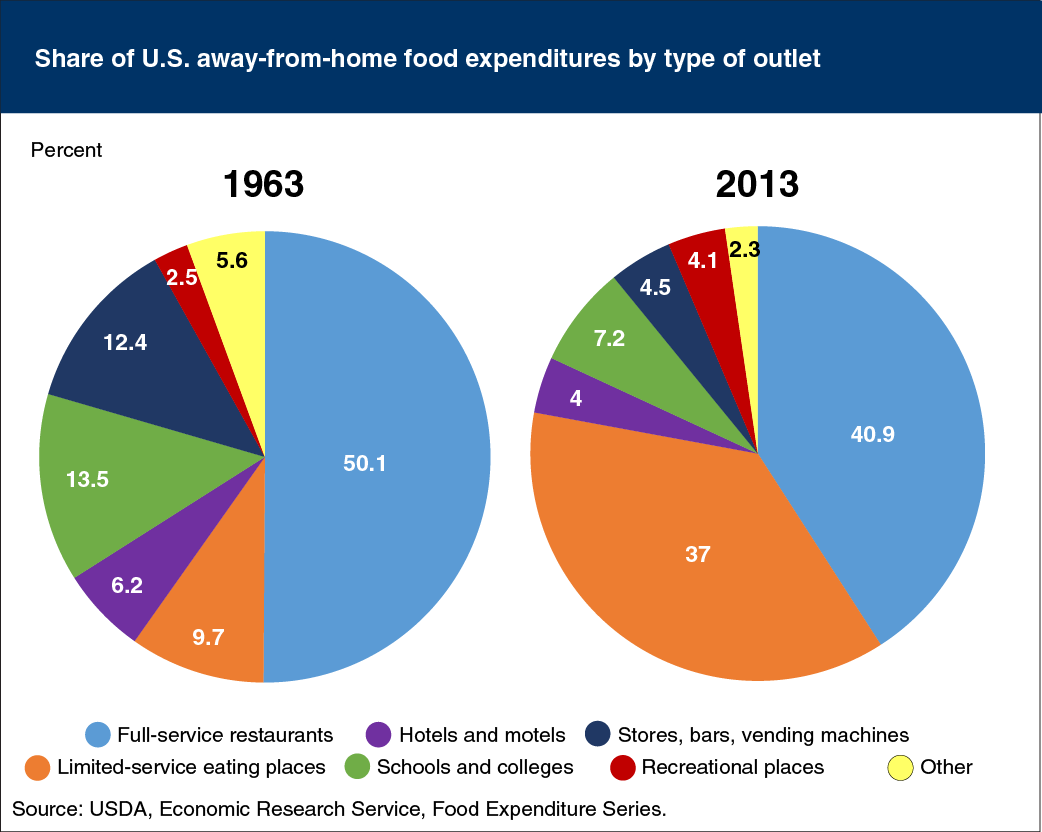
Expenditures in the food-away-from-home sector (FAFH) totaled $ 705.9 billion in 2013, 49.6 percent of total U.S. food spending for that year. Full-service restaurants and limited-service eating places accounted for 77.9 percent of FAFH expenditures in 2013; 50 years ago, their combined share stood at 59.8 percent. In 1963, FAFH spending made up 28.6 percent of total food expenditures. Americans’ FAFH sources were more diverse that year than in 2013, with relatively more away-from-home eating taking place in hotels and motels, in schools and colleges, and in stores, bars, and from vending machines. During the last half century, full-service restaurants’ share of FAFH expenditures fell from 50.1 to 40.9 percent, while limited-service eating places’ share more than tripled—from 9.7 percent of FAFH expenditures in 1963 to 37.0 percent in 2013. The only other sector whose share of the total FAFH market has risen during the last 50 years was food sales at recreational places, such as theaters and sports venues, which rose from 2.5 percent of the FAFH total in 1963 to 4.1 percent in 2013. The statistics in this chart are from ERS’s Food Expenditures data product.