

Poorest U.S. households spent 36 percent of their income on food in 2013
- by Annemarie Kuhns
- 5/4/2015
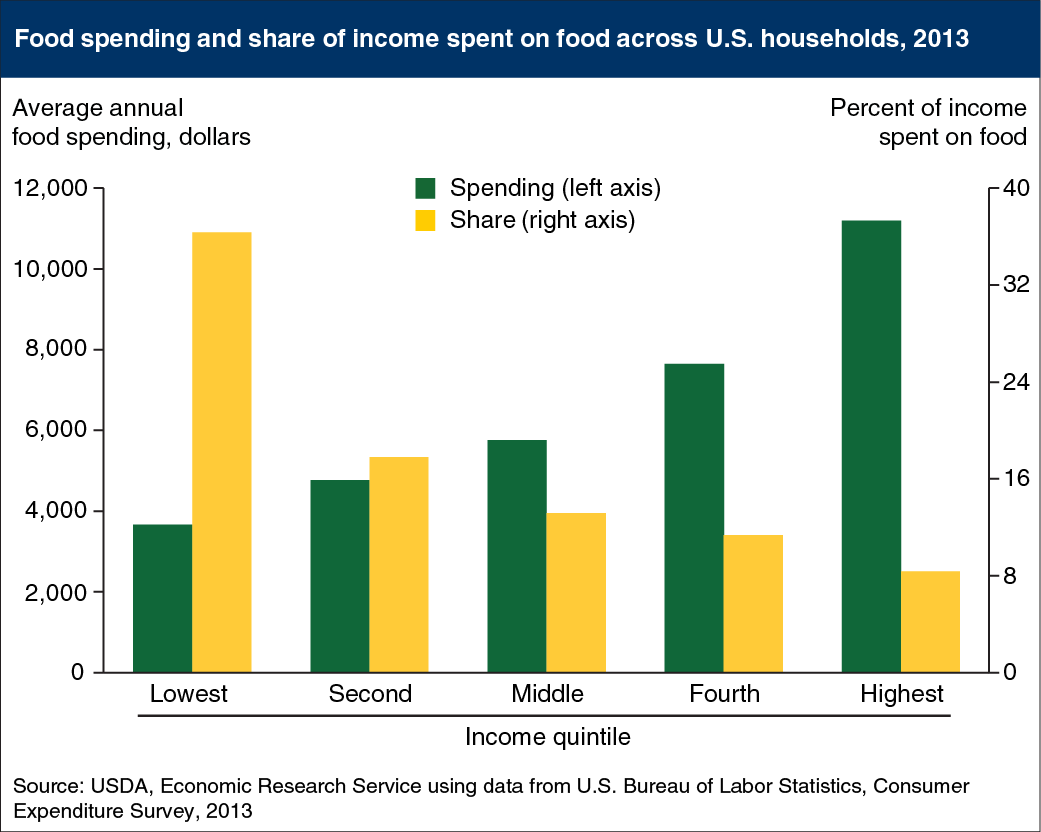
While households spend more money on food when their incomes rise, food expenditures represent a smaller portion of income as households allocate additional funds to other goods. In 2013, U.S. households in the middle income quintile, with an average 2013 after-tax income of $43,592, spent an average of $5,728 on food, or 13.1 percent of their incomes. The lowest income households—those with annual after-tax incomes of $10,092 and below in 2013—spent $3,655 on food on average, or 36.2 percent of their incomes. Since 2009, rising food prices and falling incomes put pressure on food budgets. In pre-recession 2006, households in the lowest income quintile spent 32 percent of their incomes on food and middle income households 12.8 percent. Between 2006 and 2013, average incomes for the lowest quintile rose only 1.2 percent and fell 0.5 percent for middle income earners. This chart is from the Food Prices and Spending section of ERS’s Ag and Food Statistics: Charting the Essentials data product.