

Higher disability rates reported in rural areas and the South
- by Timothy Parker
- 10/23/2014
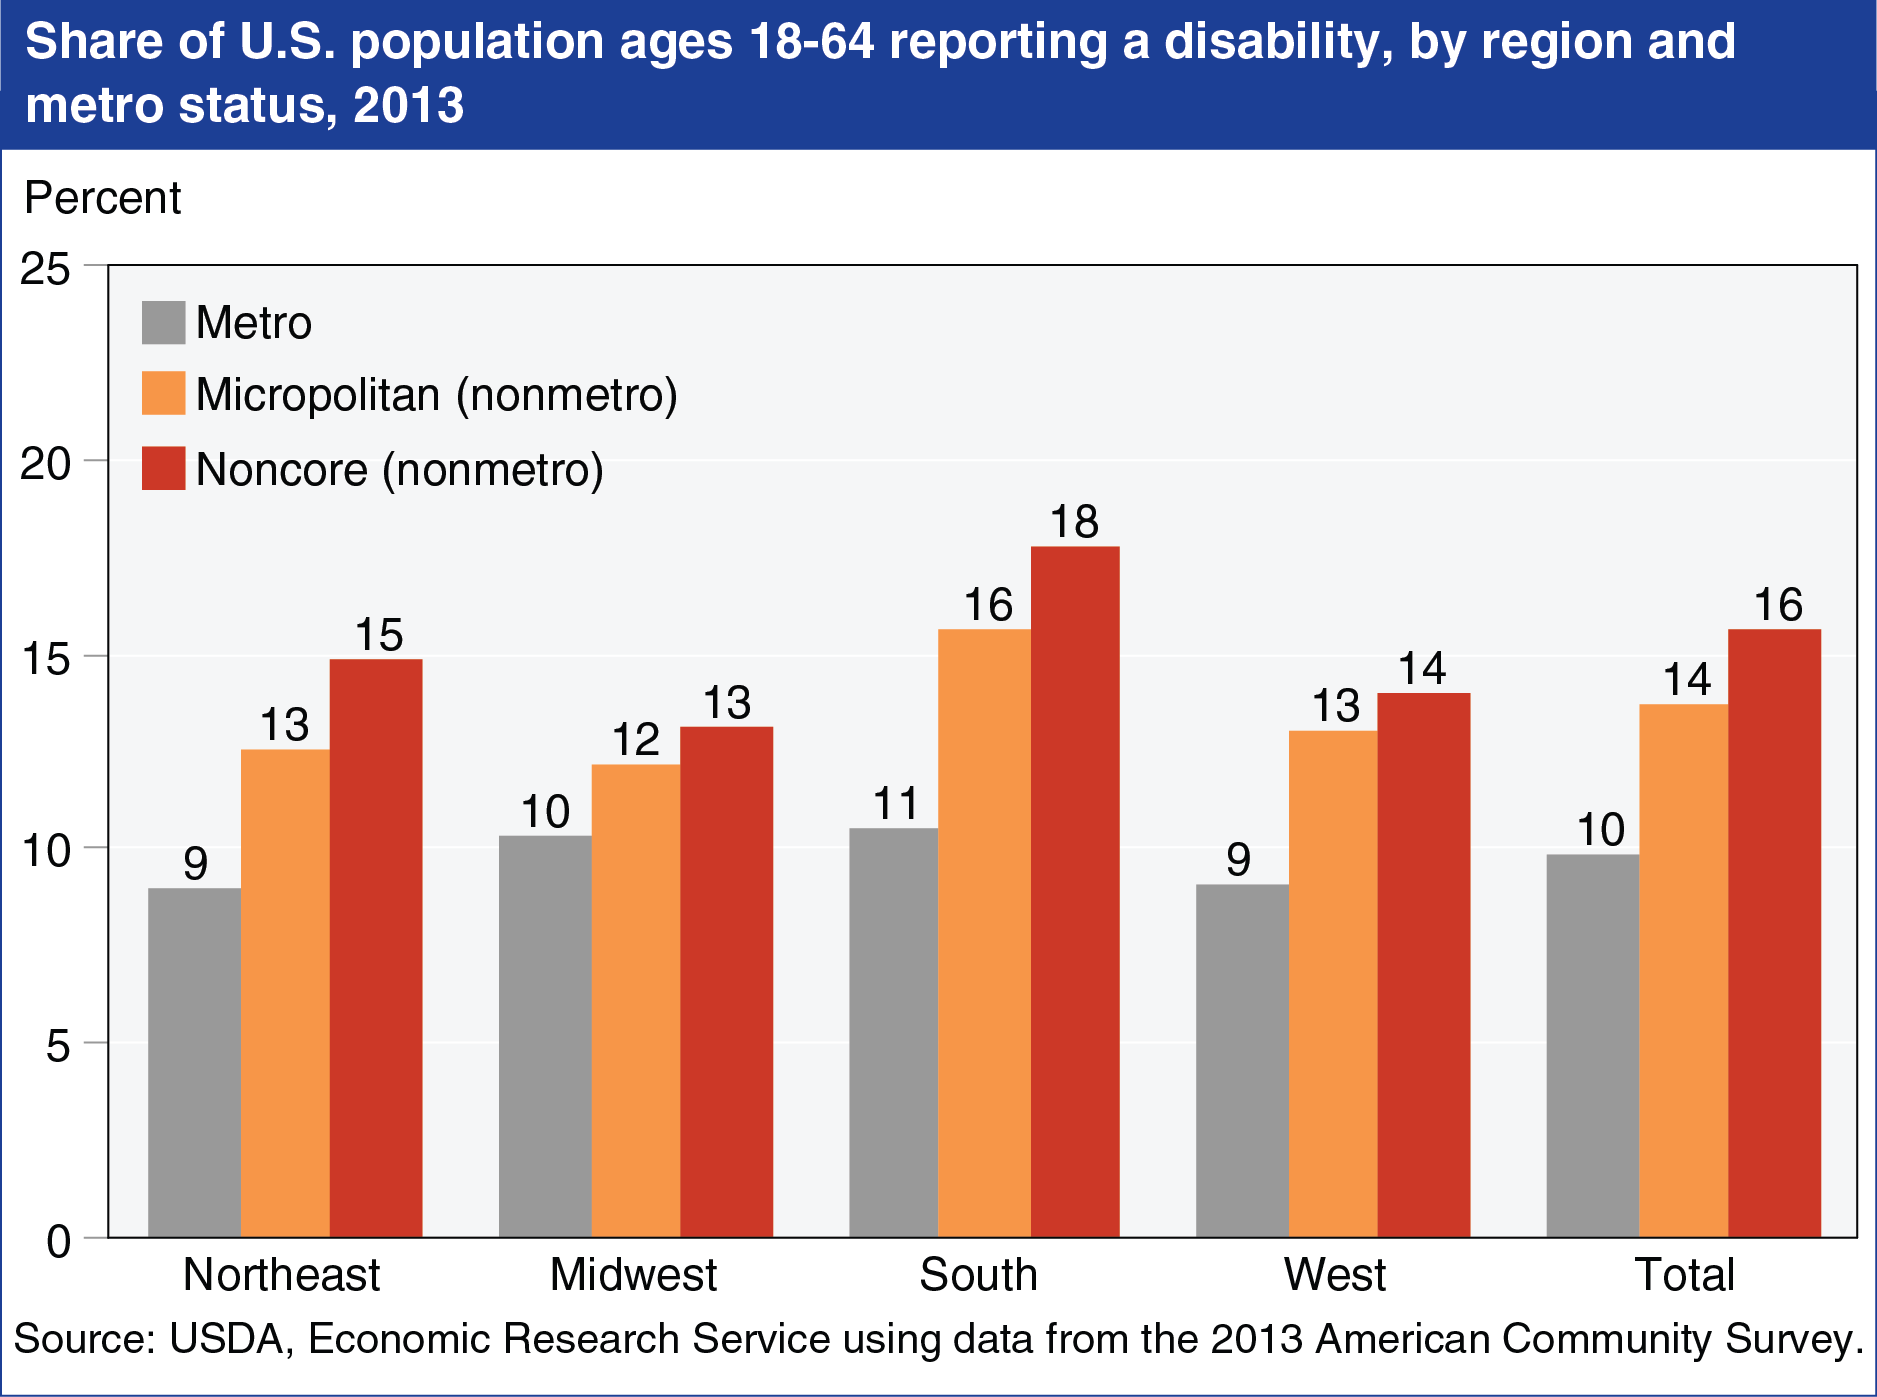
Data from the 2013 American Community Survey show that the more rural an area (micropolitan counties with an urban core population of 10,000 to 49,999 and nonmetropolitan noncore counties with an urban population less than 10,000), the higher its share of residents with self-reported disabilities. Survey respondents ages 18 to 64 in the civilian nonistitutionalzed population were asked if they had serious difficulty with hearing, vision, cognitive ability, walking or climbing stairs, self-care, and independent living. Those who responded that they had difficulty with one or more of these conditions were reported to have a disability. Urban areas (metropolitan counties with an urban core population of 50,000 or more) had the lowest disability rates. The highest disability rates were found in the micropolitan and noncore South, while the Midwest had the lowest rural disability rates. Contributing negatively to the health conditions of rural residents are their lower average socioeconomic status, higher incidence of both smoking and obesity, lower levels of physical activity, older average age, and higher risks of workplace hazards. And in areas losing population, as is true of many rural areas, if the disabled are less likely to migrate, disability rates will increase over time. This chart updates one found in the ERS report, Health Status and Health Care Access of Farm and Rural Populations, EIB-57, August 2009.