
Mixed picture for recent returns to production of U.S. field crops
- by Linda Foreman
- 6/25/2014
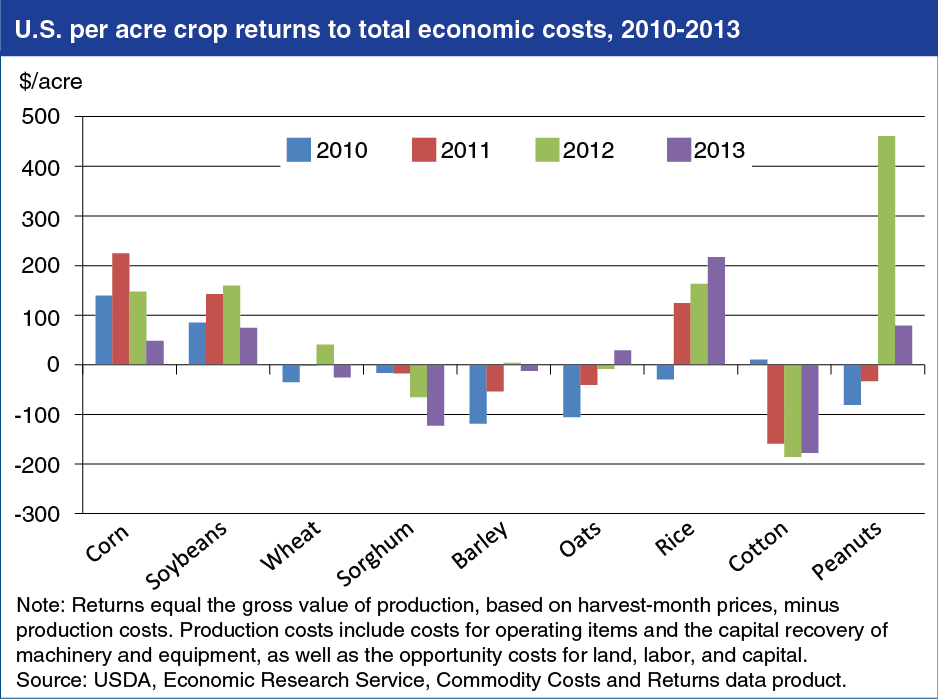
Estimates of U.S. crop returns per acre reveal large differences in crop profitability across commodities and over time during 2010-13. Returns to crop production are defined as the gross value of production less total economic costs. Total economic costs include operating costs such as seeds, fertilizer, and pesticides; the capital recovery cost for machinery and equipment; and the costs—known as opportunity costs—of employing land, labor, capital and other owned resources that have alternative uses. While returns to total economic costs for corn, soybeans, rice, and peanuts were positive, on average, for the 2010-13 period, average returns for other major crops were negative. For most crops, changes in farm prices and the gross value of production per acre, rather than changes in production costs, have driven returns to total economic costs. Lower prices contributed to reduced returns for corn, soybeans, wheat, sorghum, and peanuts in 2013, while price and yield increases improved returns for oats and rice. The negative returns over total economic costs for some crops indicate that that those producers realized a lower rate of return to their land, labor, and capital than the benchmark rates of return used in ERS commodity cost and returns accounts; returns over operating costs alone were positive for all crops throughout the period. This chart is based on data found in Commodity Costs and Returns.