

Rural child poverty at highest level since mid-1980s
- by Tracey Farrigan
- 3/14/2014
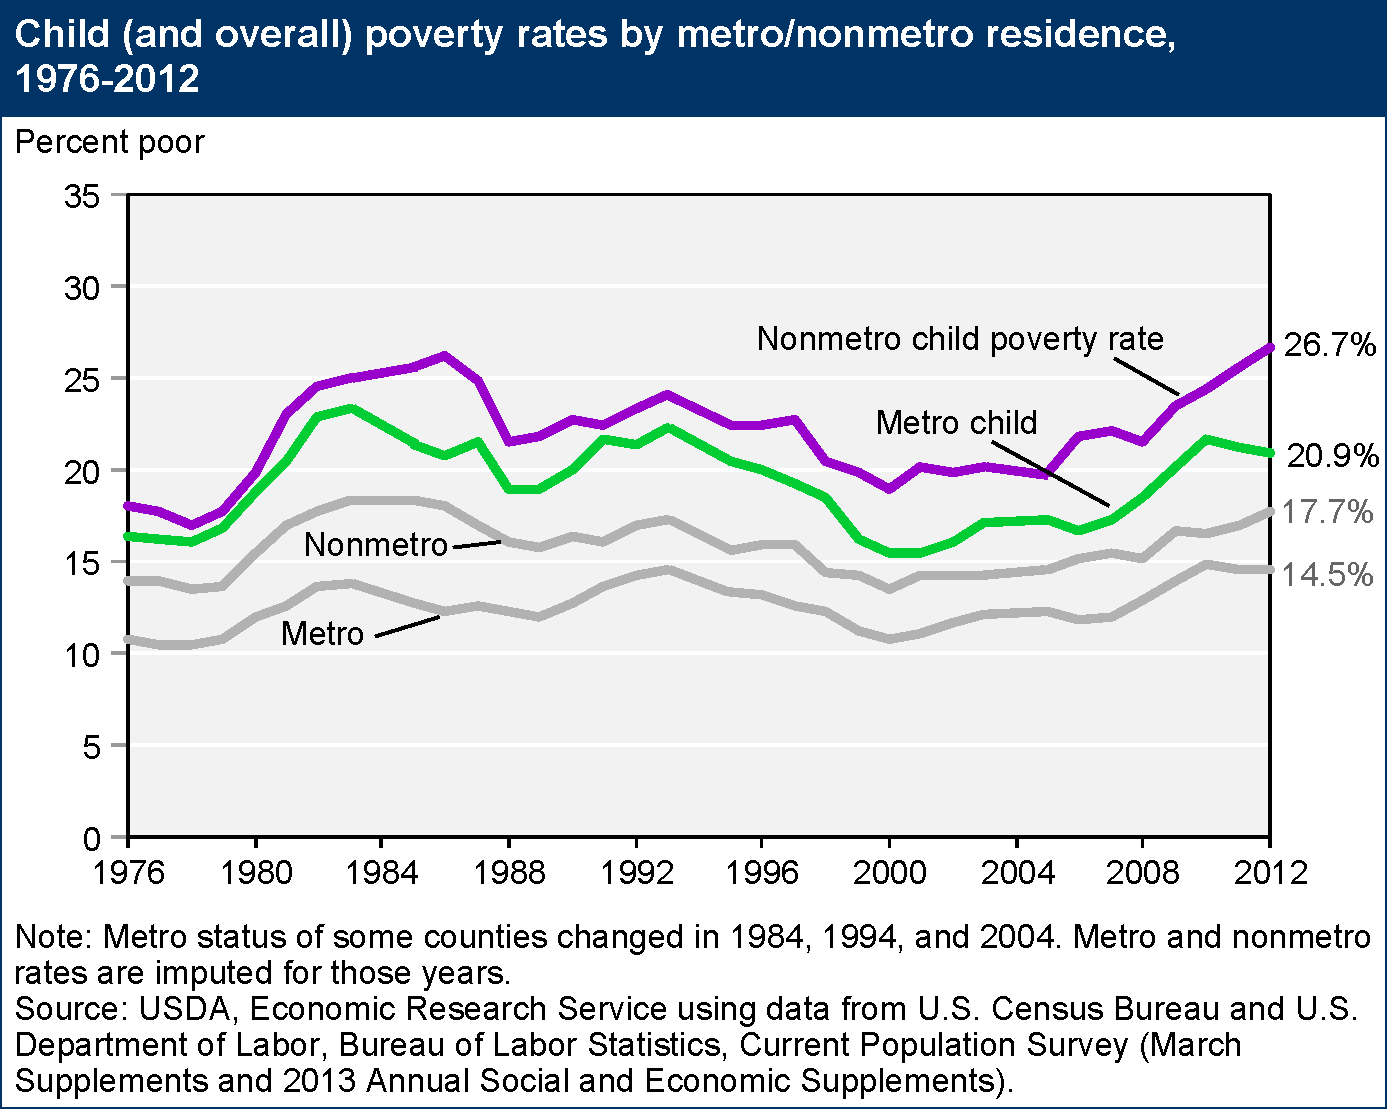
Like the overall poverty rate, child poverty in nonmetro (rural) areas of the country has historically been higher than in metro (urban) areas. In 2012, nonmetro child poverty increased to 26.7 percent—its highest level in nearly 3 decades—while the metro rate declined slightly to 20.9 percent. Poverty among children is an important indicator of the nation’s long-term well-being since child poverty often has an impact that carries throughout a lifetime, particularly if the child lived in poverty at an early age. As with the early 1980s recession, rural children have been disproportionately affected by the recent economic downturn. Child poverty is more sensitive to labor market conditions than overall poverty. Older members of the labor force, including empty nesters and retirees, are less affected by job downturns, and families with children need higher incomes to stay above the poverty line than singles or married couples without children. This chart is found in the ERS topic on Rural Poverty & Well-being.