

Food insecurity increased in most States over the last decade
- by ERS
- 7/24/2013
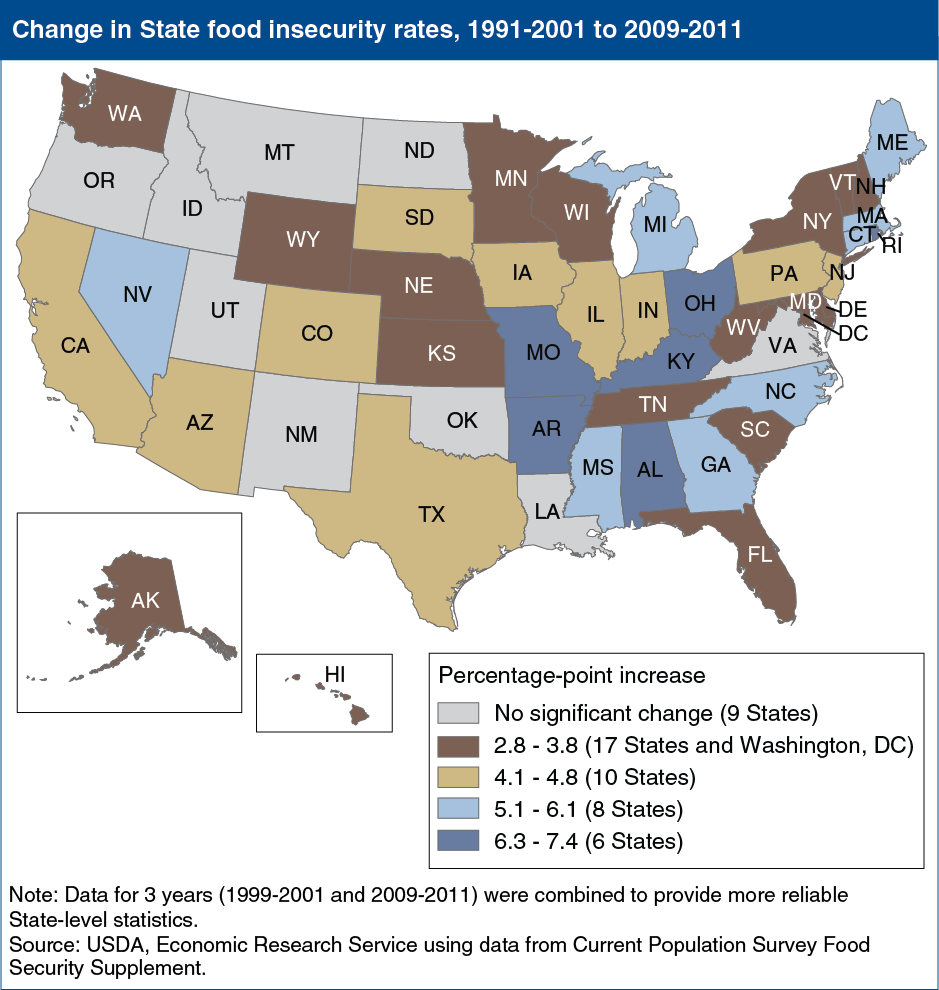
As the 2007-09 Great Recession and its accompanying higher unemployment took its toll on U.S. families, food insecurity at the national level increased. In 2011, 14.9 percent of U.S. households were food insecure—up from 10.7 percent in 2001. Food-insecure households are those that were, at times, unable to acquire adequate food for one or more household members due to insufficient money or other resources for food. States differed both in the percentage of households that were food insecure and in the change in that prevalence rate during the period. From 2001 to 2011, the prevalence of food insecurity was essentially unchanged in 9 States and grew for the remaining 41 States and Washington, DC. This chart appears in “Food Insecurity Increased in Most States From 2001 to 2011” in the July 2013 issue of ERS’s Amber Waves magazine.