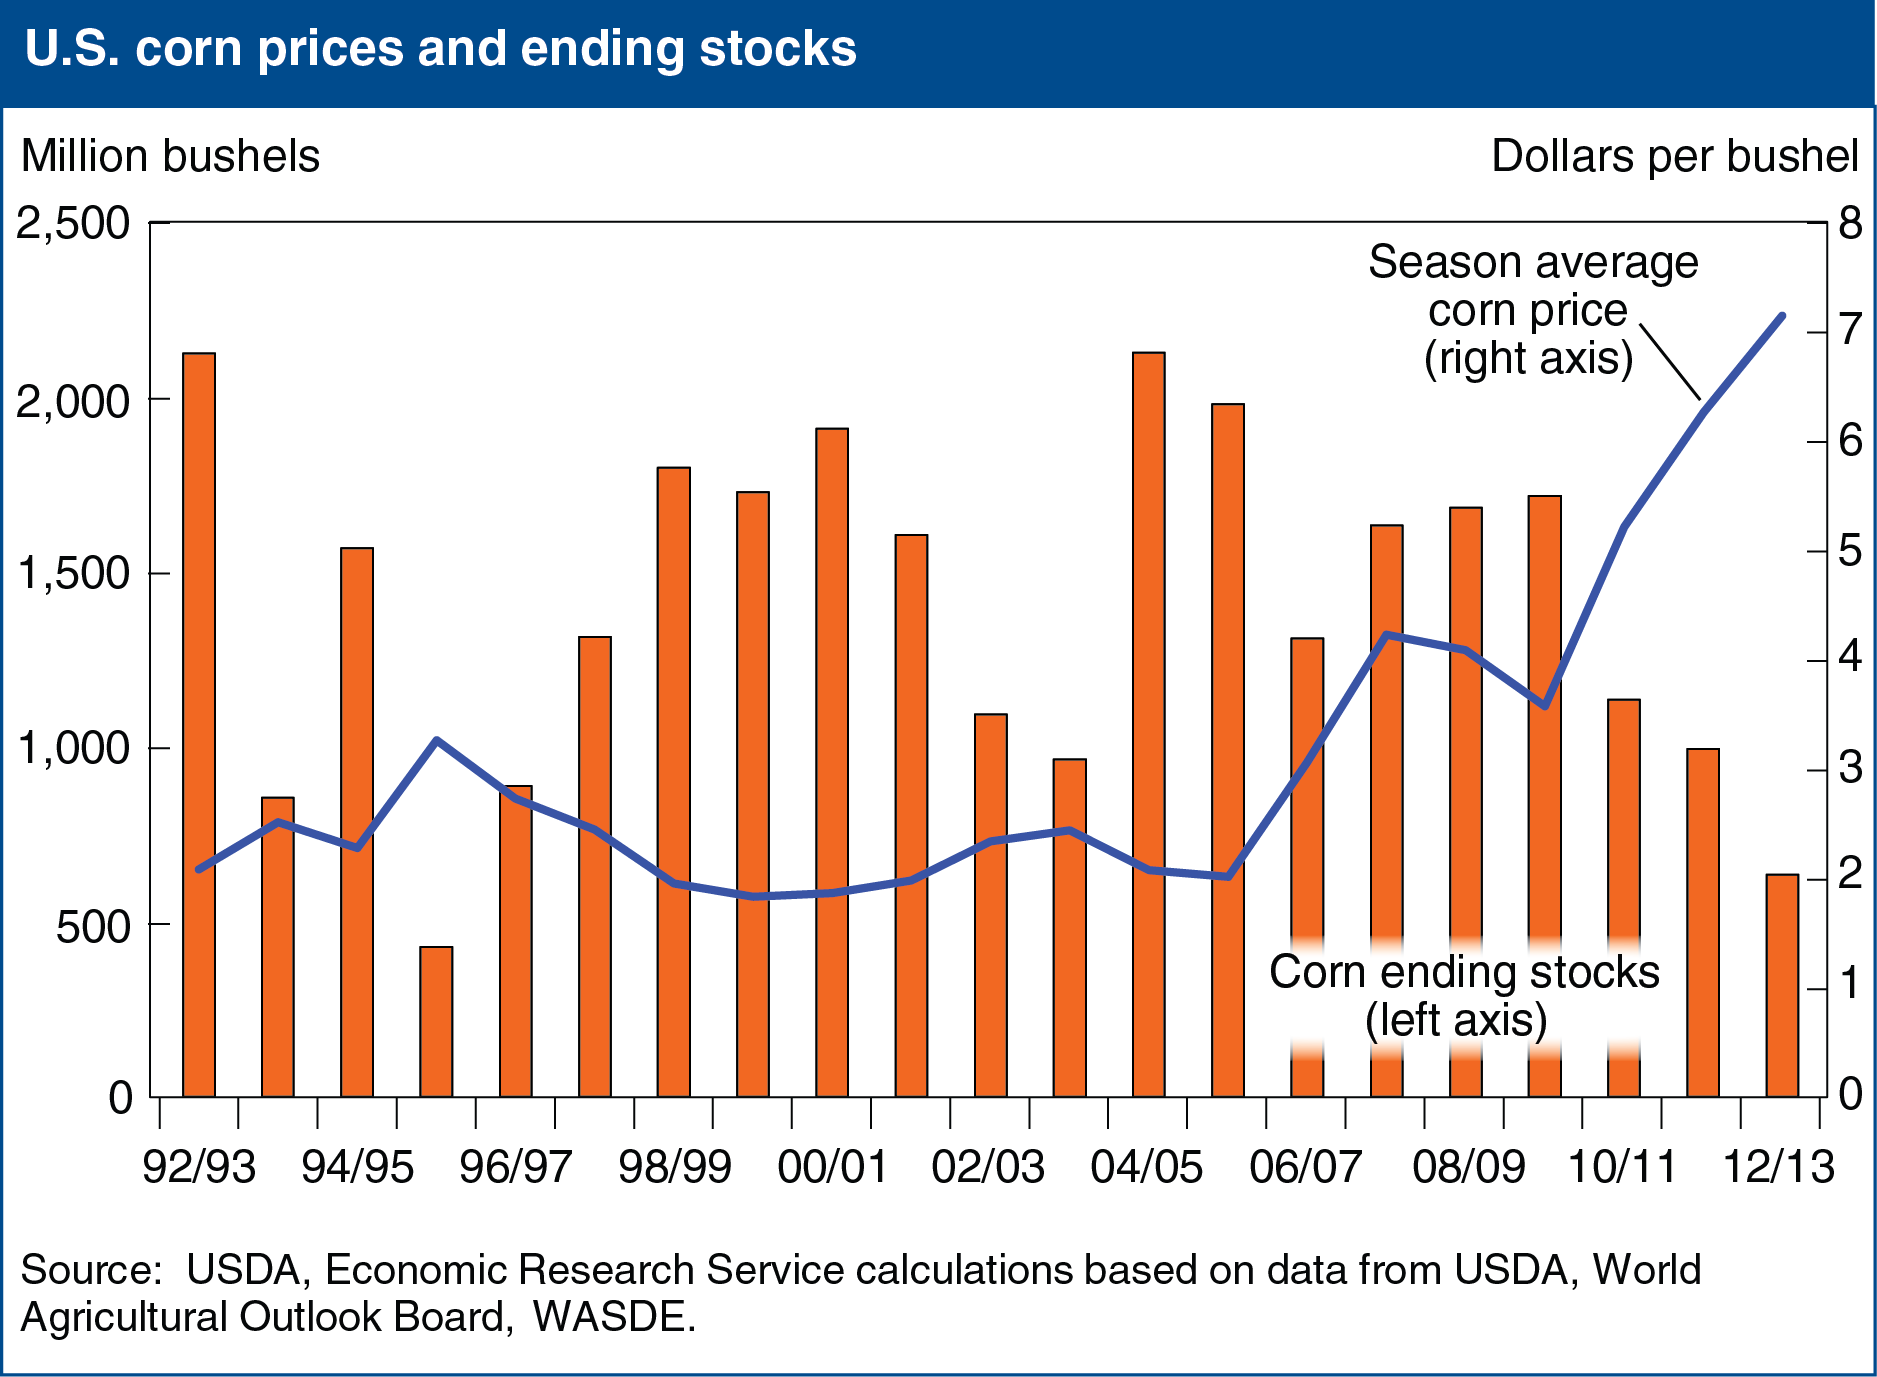
U.S. corn prices maintain record highs as stocks remain tight
- by Jennifer K. Bond
- 3/14/2013

U.S. corn ending stocks for 2012/13 are projected at 632 million bushels, down 36 percent from ending stocks for the 2011/12 marketing year and the lowest since 1995/96. Subsequent to the 2009/10 season, ending stocks have demonstrated an annual decline attributable to the combination of sustained strong demand for corn from feed, ethanol, and export markets and, particularly in 2012/13, adverse weather conditions that hindered production. Sustained demand and drought-reduced output have pushed prices upward. At $7.10 per bushel, the forecast 2012/13 season-average farm price is the highest on record and is a reflection of very tight corn supplies. Starting in 2010/11, the correlation between declining ending stocks and increasing corn prices has become especially strong, underscoring the linkages between corn availability and demand. This chart appears in Feed Grain Chart Gallery, March 2013.


