

Uses of cropland change over time
- by Economic Research Service
- 6/22/2012
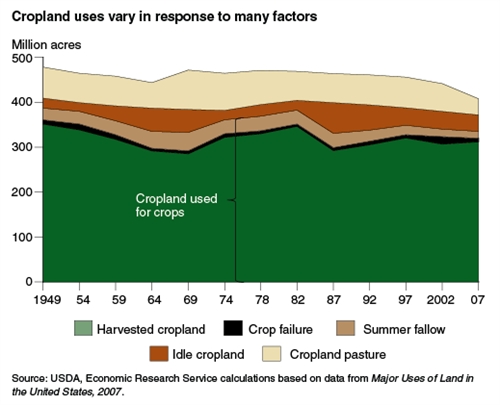
Market forces, changes in farm programs, and changes in technology affect the supply and demand for land used for crop production. Between 1949 and 1969, cropland used for crops decreased by 54 million acres and then peaked at 383 million acres in 1982, when no cropland was diverted through Government-acreage reduction programs. Since 1980, cropland used for crops has been relatively stable, despite significant variation in commodity prices. However, relatively stable patterns of changes in land use at the national level obscure larger shifts in land use at regional and State levels. For example, between 1964 and 2007, cropland used for crops increased by 11 million acres in the Corn Belt and decreased by a net 11 million acres in the remaining regions. Both the Northeast and Southeast experienced a long-term decline in cropland used for crops. Urban pressures and a comparative disadvantage in many crops resulted in the conversion of cropland to other uses in these regions. This chart is found in the March 2012 issue of Amber Waves magazine.