

Editor's Pick 2015, #1:<br>One in five rural counties had child poverty rates over 33 percent
- by David McGranahan
- 12/31/2015
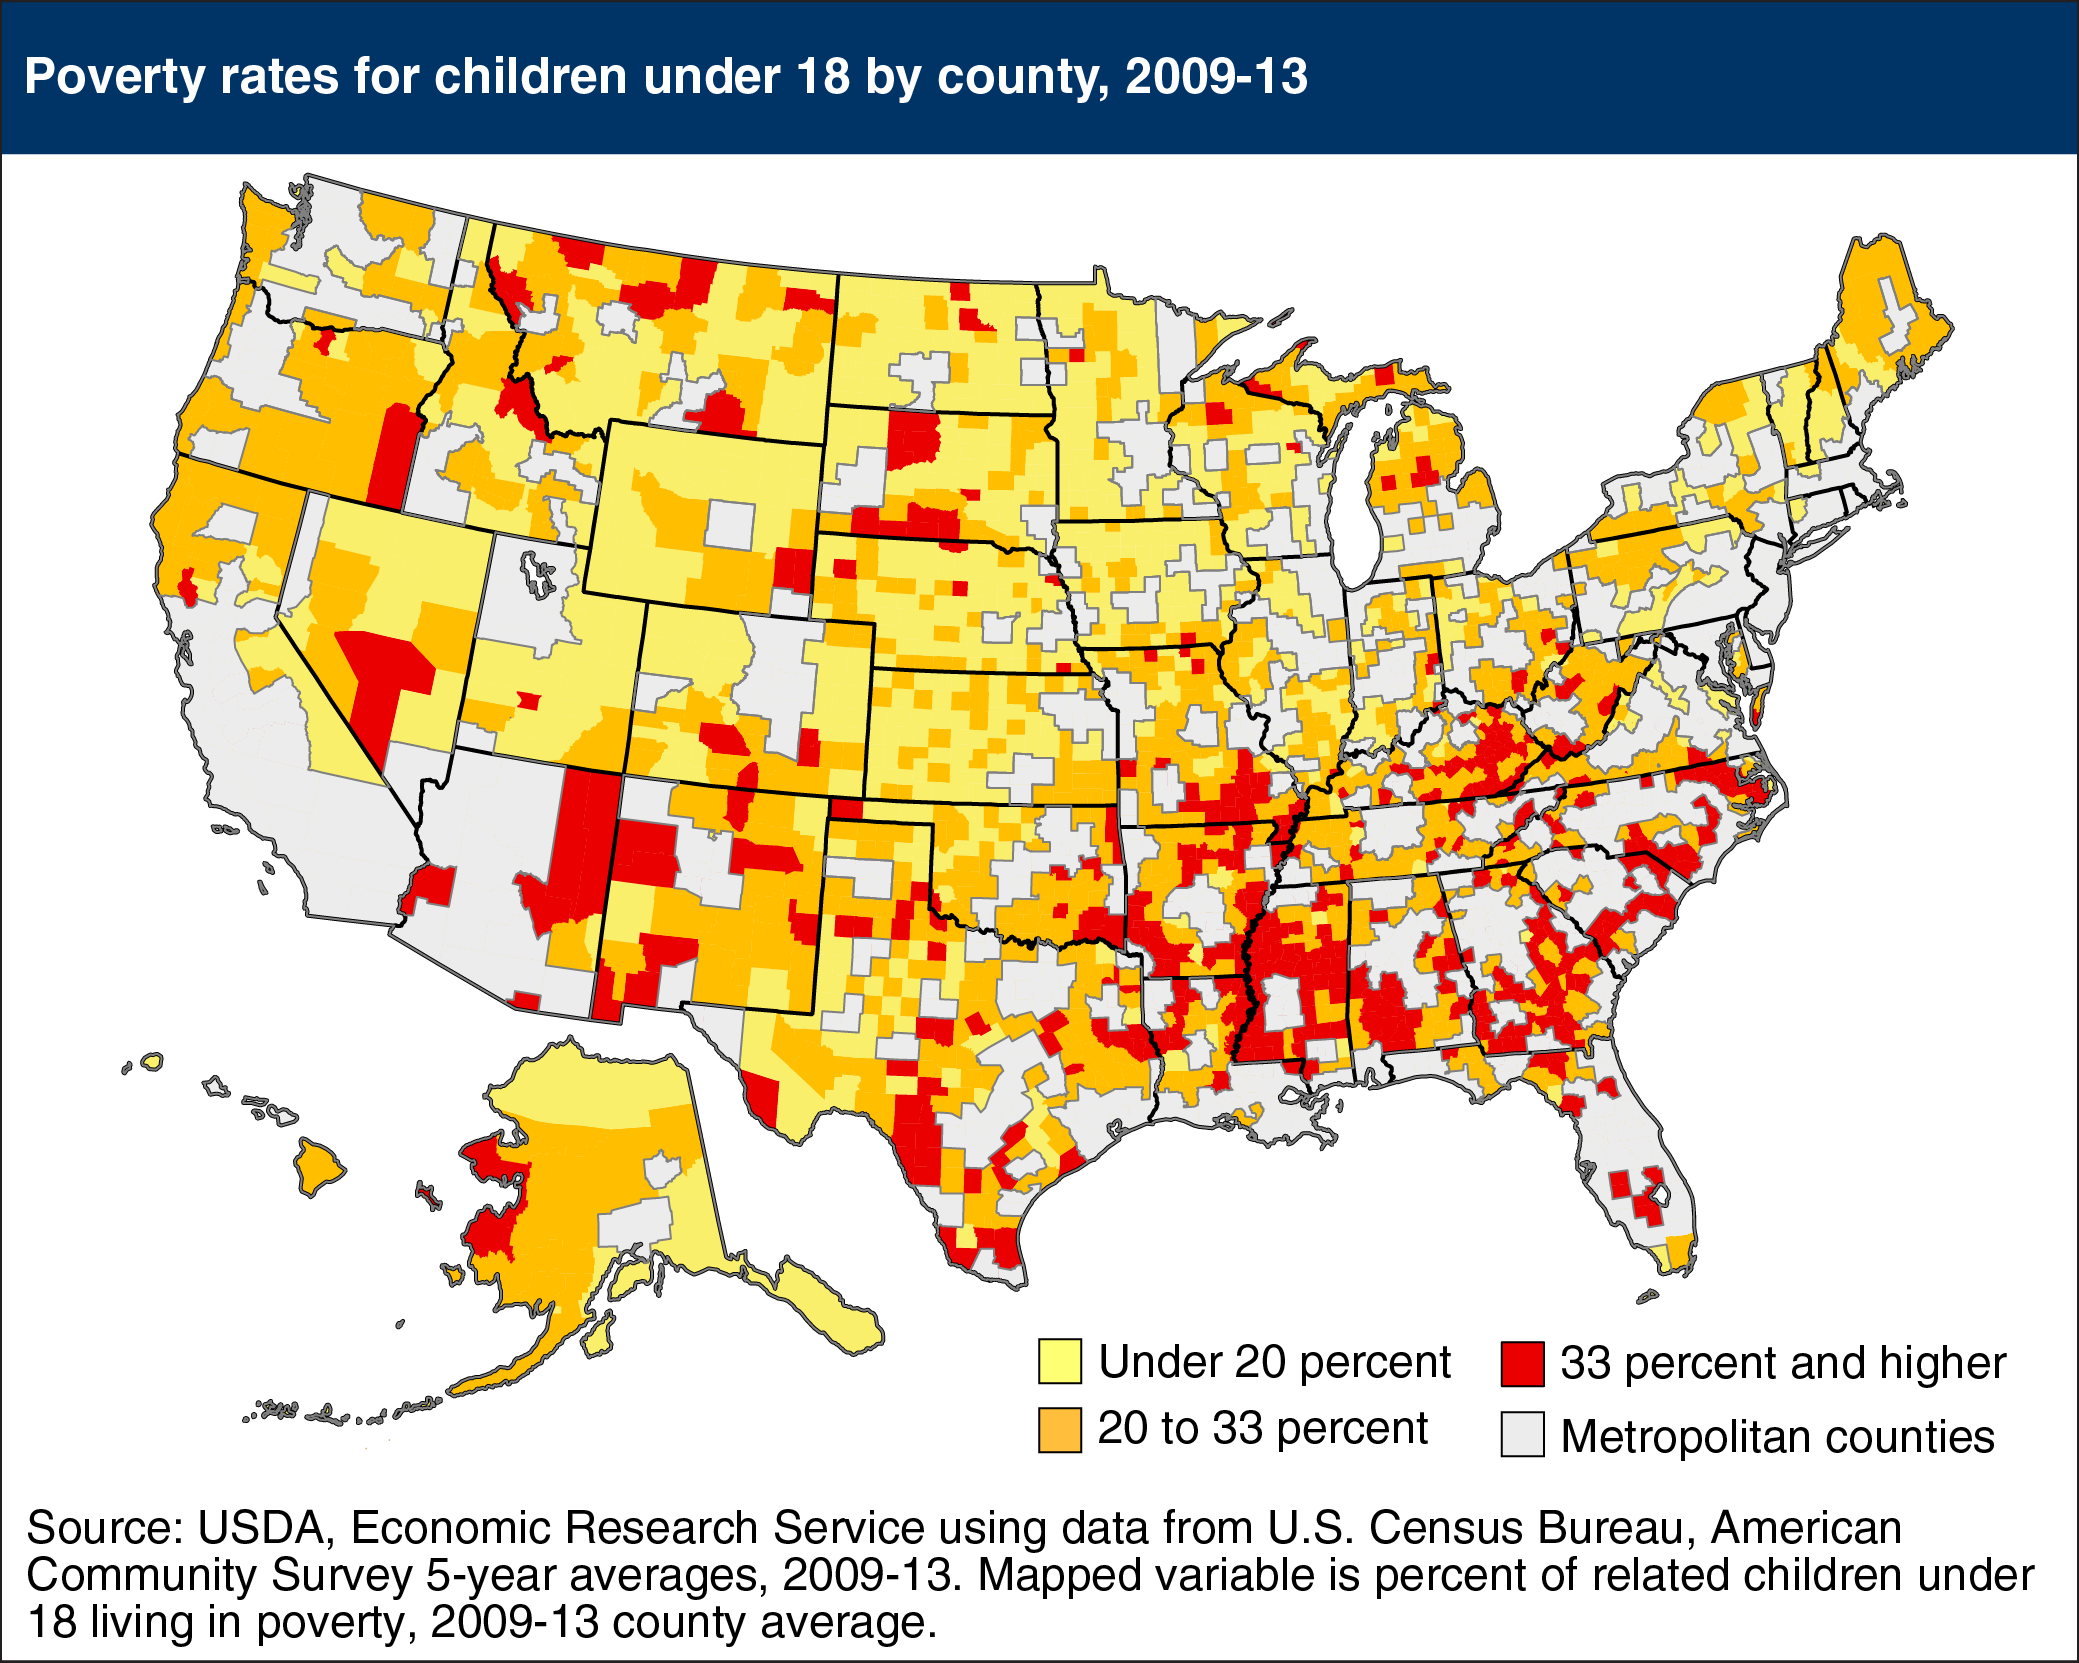
Child poverty rates varied considerably across nonmetropolitan (rural) counties according to 2009-13 county averages (data on poverty for all U.S. counties are available from the American Community Survey only for 5-year averages). According to the official poverty measure, one in five rural counties had child poverty rates over 33 percent. Child poverty has increased since the 2000 Census (which measured poverty in 1999) and the number of rural counties with child poverty rates of over 33 percent has more than doubled. Improving young adult education levels tended to lower child poverty rates over the period, but increases in single-parent households and economic recession were associated with rising child poverty. Metropolitan counties had average child poverty rates of 21 percent in 2009-13. This map appears in the July 2015 Amber Waves feature, Understanding the Geography of Growth in Rural Child Poverty.