
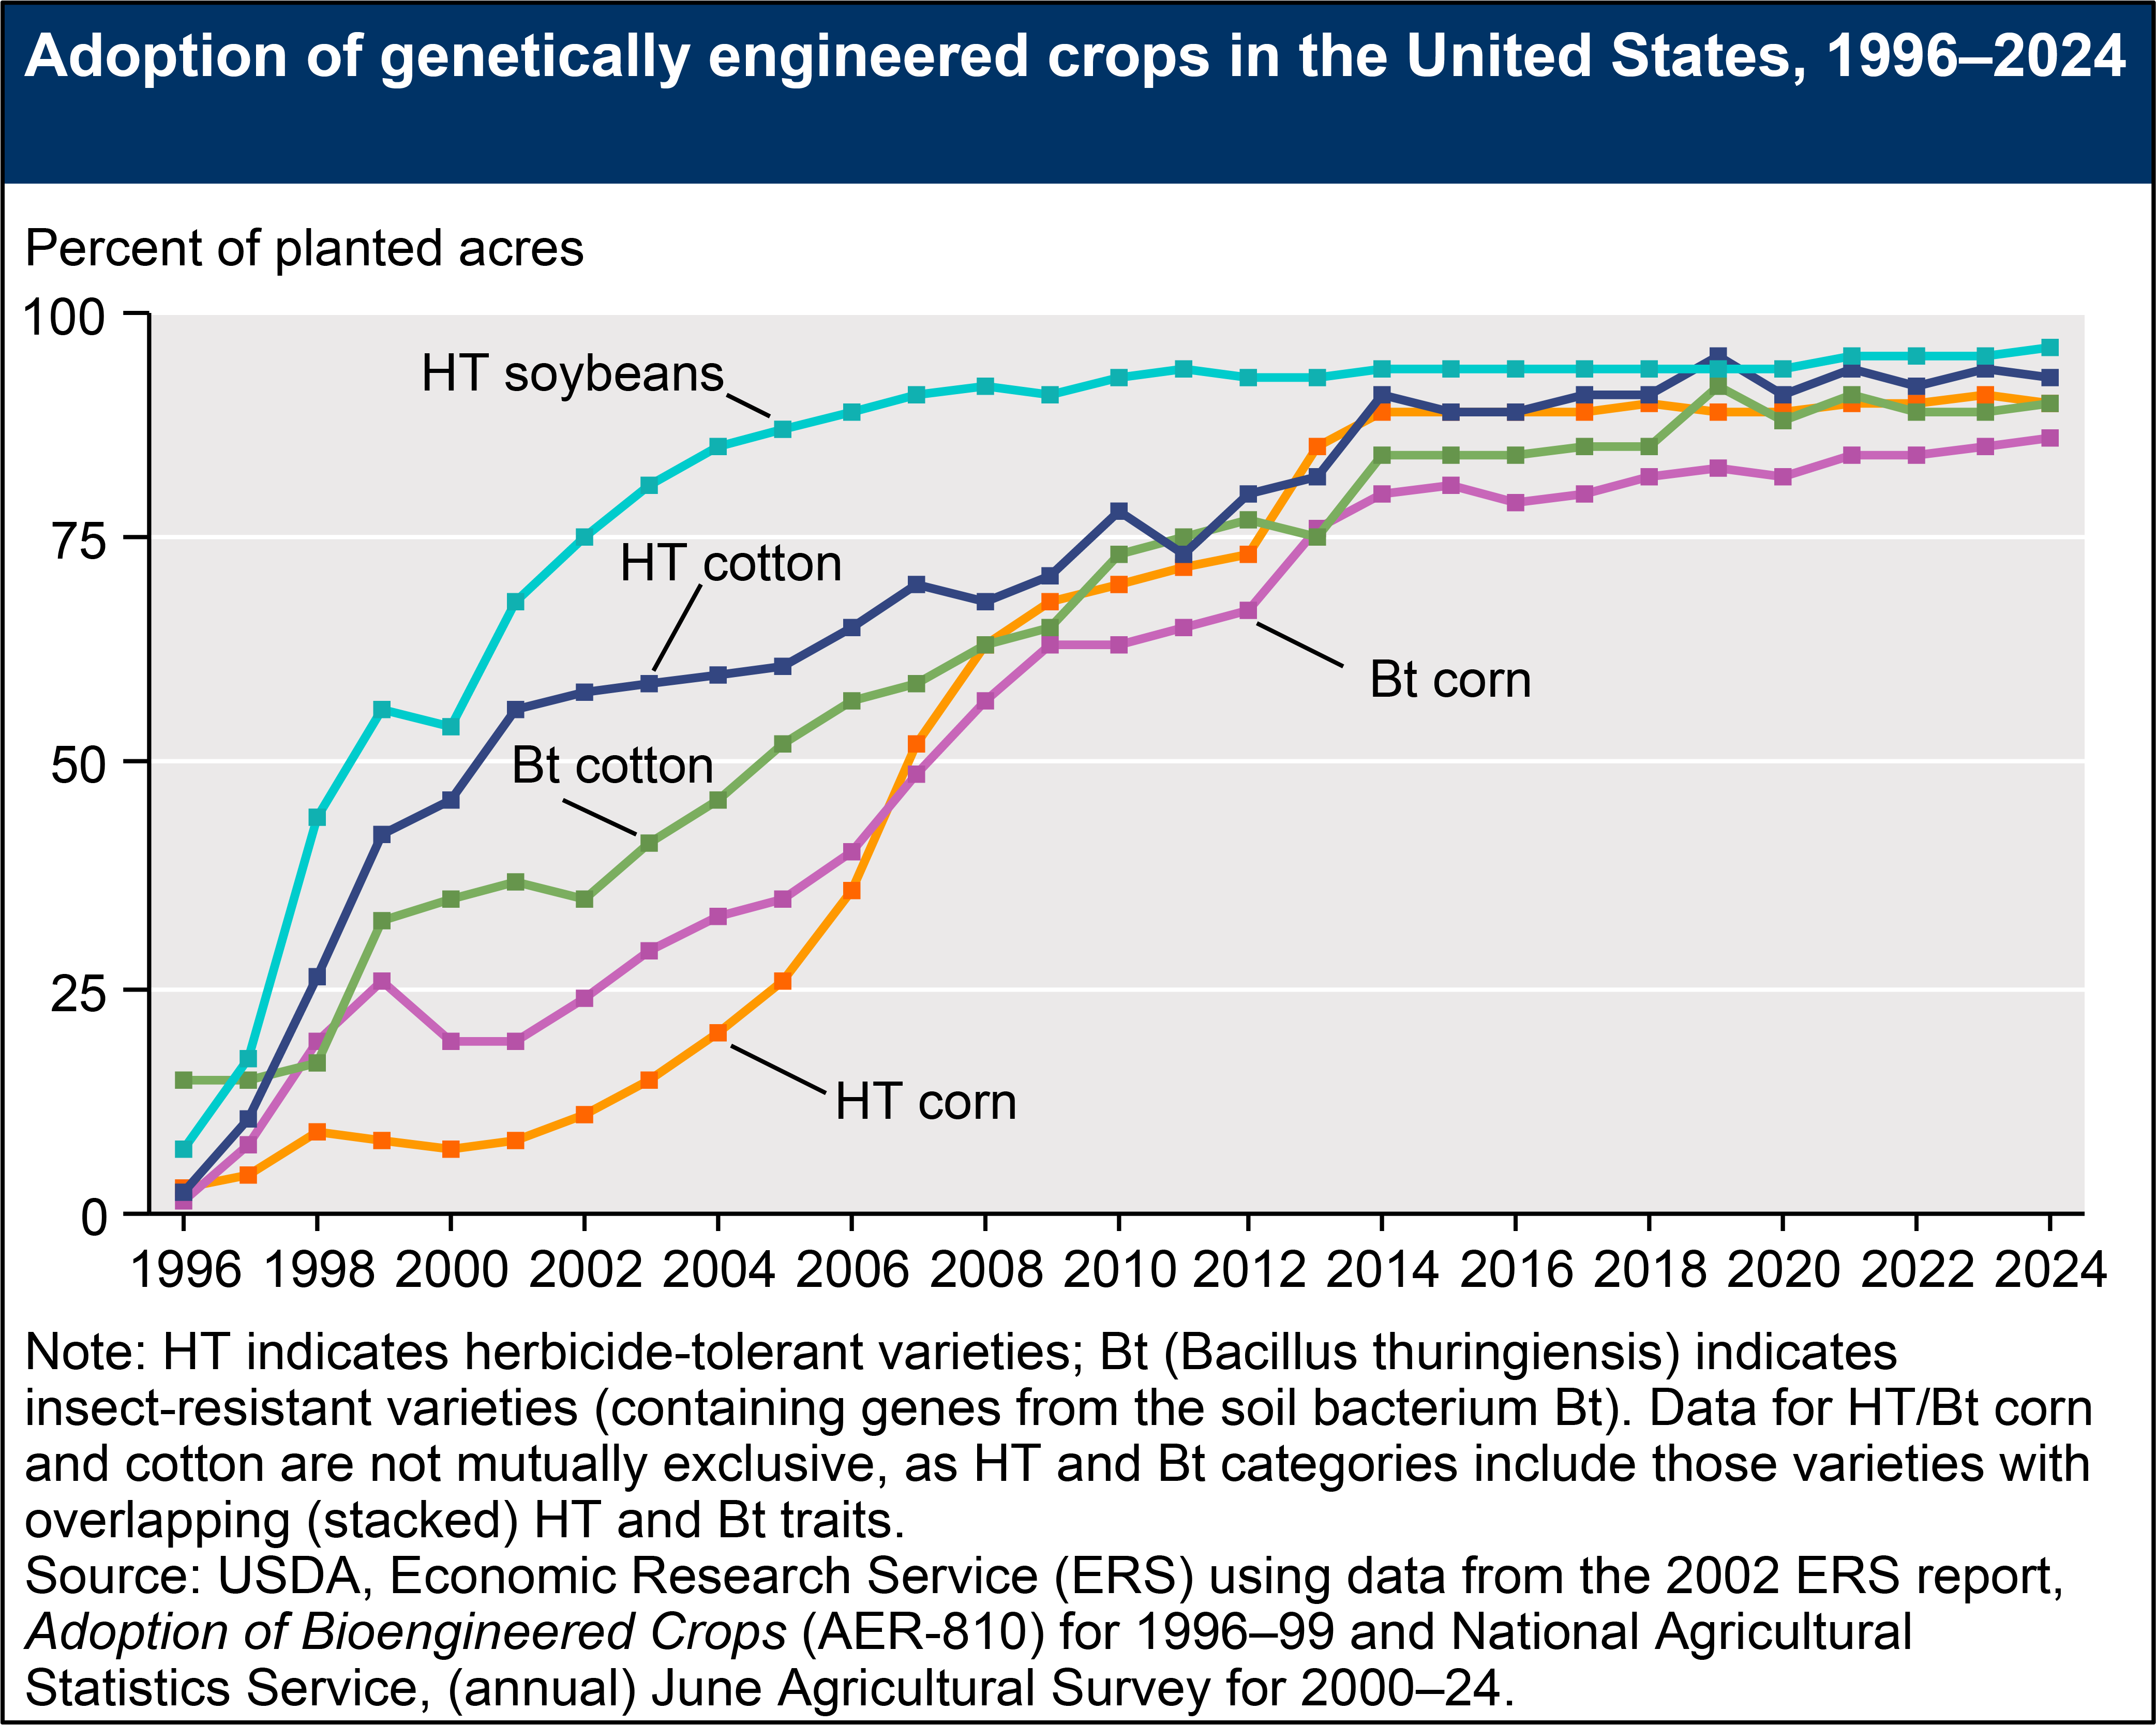
Adoption of genetically engineered crops in the United States, 1996–2024
- by Laura Dodson
- 8/26/2024
Download chart image | Chart data
Genetically Engineered (GE) seeds were commercially introduced in the United States for major field crops in 1996, with adoption rates increasing in the years that followed. Currently, more than 90 percent of U.S. corn, upland cotton, and soybeans are produced using GE varieties. GE crops are broadly classified in this data product as herbicide-tolerant (HT), insect-resistant (Bt), or stacked varieties that are a combination of both HT and Bt traits.
We’d welcome your feedback!
Would you be willing to answer a few quick questions about your experience?