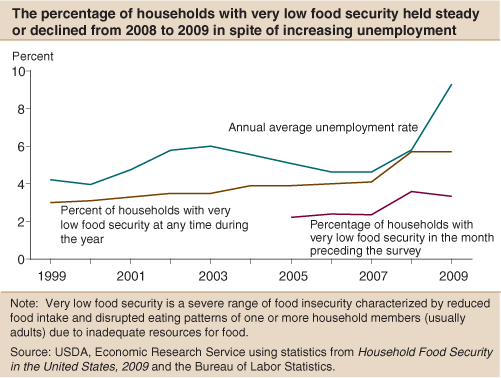
Line chart: The percentage of households with very low food security held steady or declined from 2008 to 2009 in spite of increasing unemployment
- Contact: Website Administrator
- 1/10/2012

Line chart: The percentage of households with very low food security held steady or declined from 2008 to 2009 in spite of increasing unemployment
We’d welcome your feedback!
Would you be willing to answer a few quick questions about your experience?
