

Food-away-from-home price growth outpaced food at home and overall inflation over past decade
- by Megan Sweitzer
- 6/27/2024
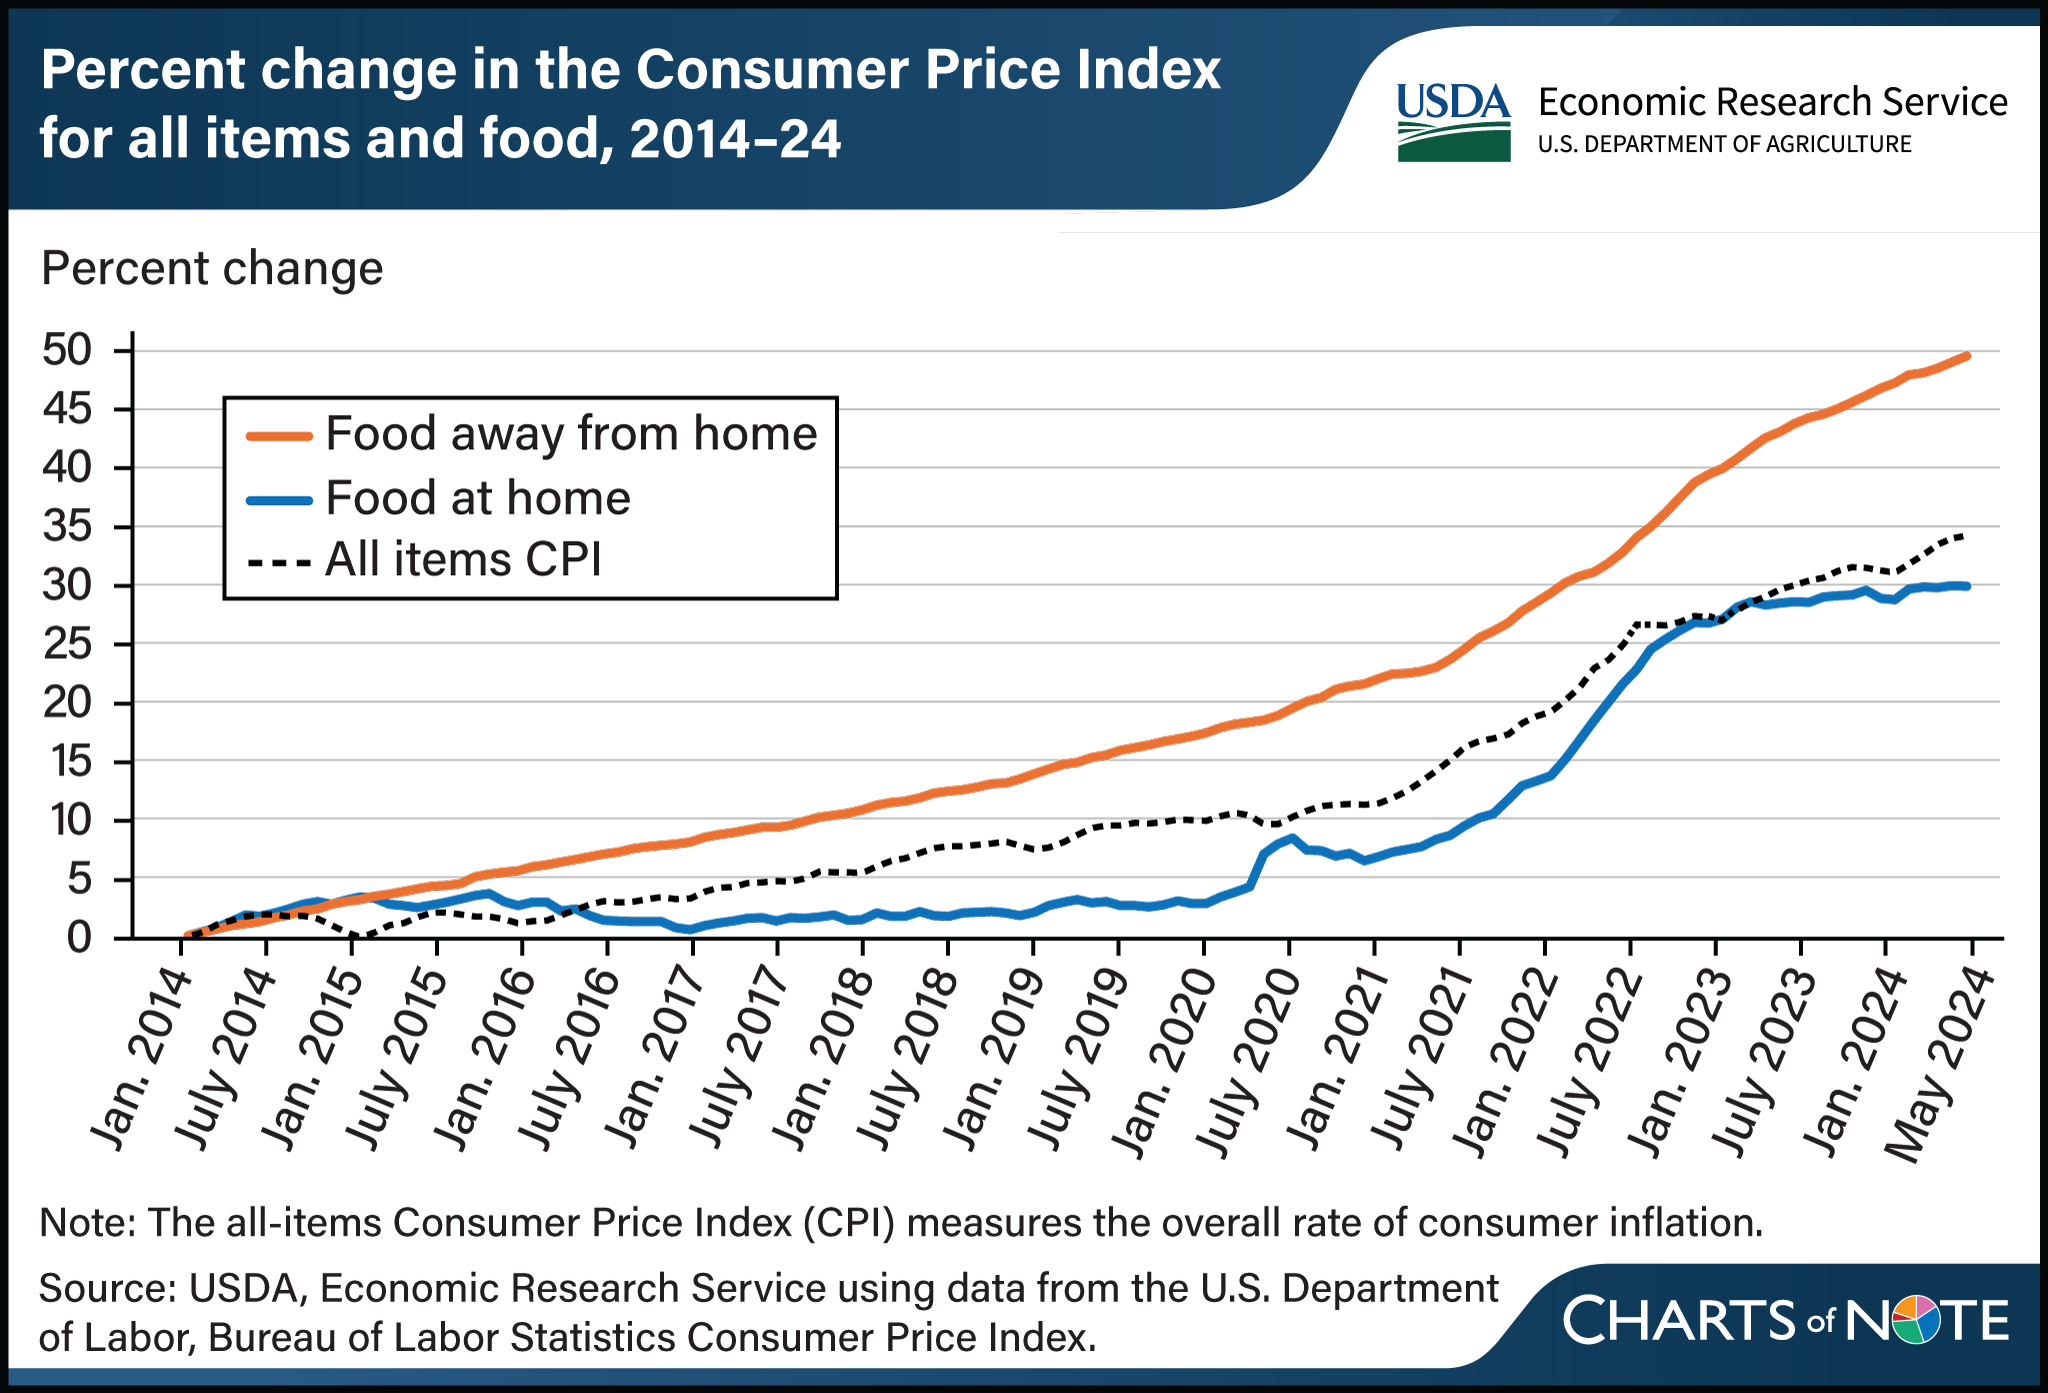
Prices for food away from home (FAFH), or eating out, grew more quickly from 2014–24 than food at home (FAH), and the overall rate of inflation. Prices for all consumer goods and services across the economy, as measured by the all-items Consumer Price Index, rose by 34.3 percent between January 2014 and May 2024. FAFH prices climbed steadily over the past decade and were 49.5 percent higher in May 2024 than January 2014, while prices for FAH, or groceries, rose 29.9 percent. Although FAH prices grew at a faster rate than the overall inflation rate at times, particularly between 2020 and 2023, FAH also had periods of minimal price change from 2015 to 2019 and since 2023, as illustrated by the relatively flat slope of the line. Food prices can be affected by economy-wide inflationary factors, such as rising input and energy prices, but the distinct services and industries that contribute to FAFH and FAH costs can lead to differing price patterns over time. USDA, Economic Research Service’s (ERS) Food Dollar Series shows that the food services industry group contributes the largest share of FAFH costs, and salaries and benefits account for a majority of costs in that industry group. In contrast, the industries contributing the largest shares of FAH costs are food processing and retail and wholesale trade. The ERS Food Price Environment: Interactive Visualization, last updated in February 2024, presents annual FAH and FAFH inflation over time and provides context for the Food Price Outlook data product.