
U.S. farm sector cash receipts, inflation adjusted, 1970–2025F
- by Farm Income Team
- 9/3/2025
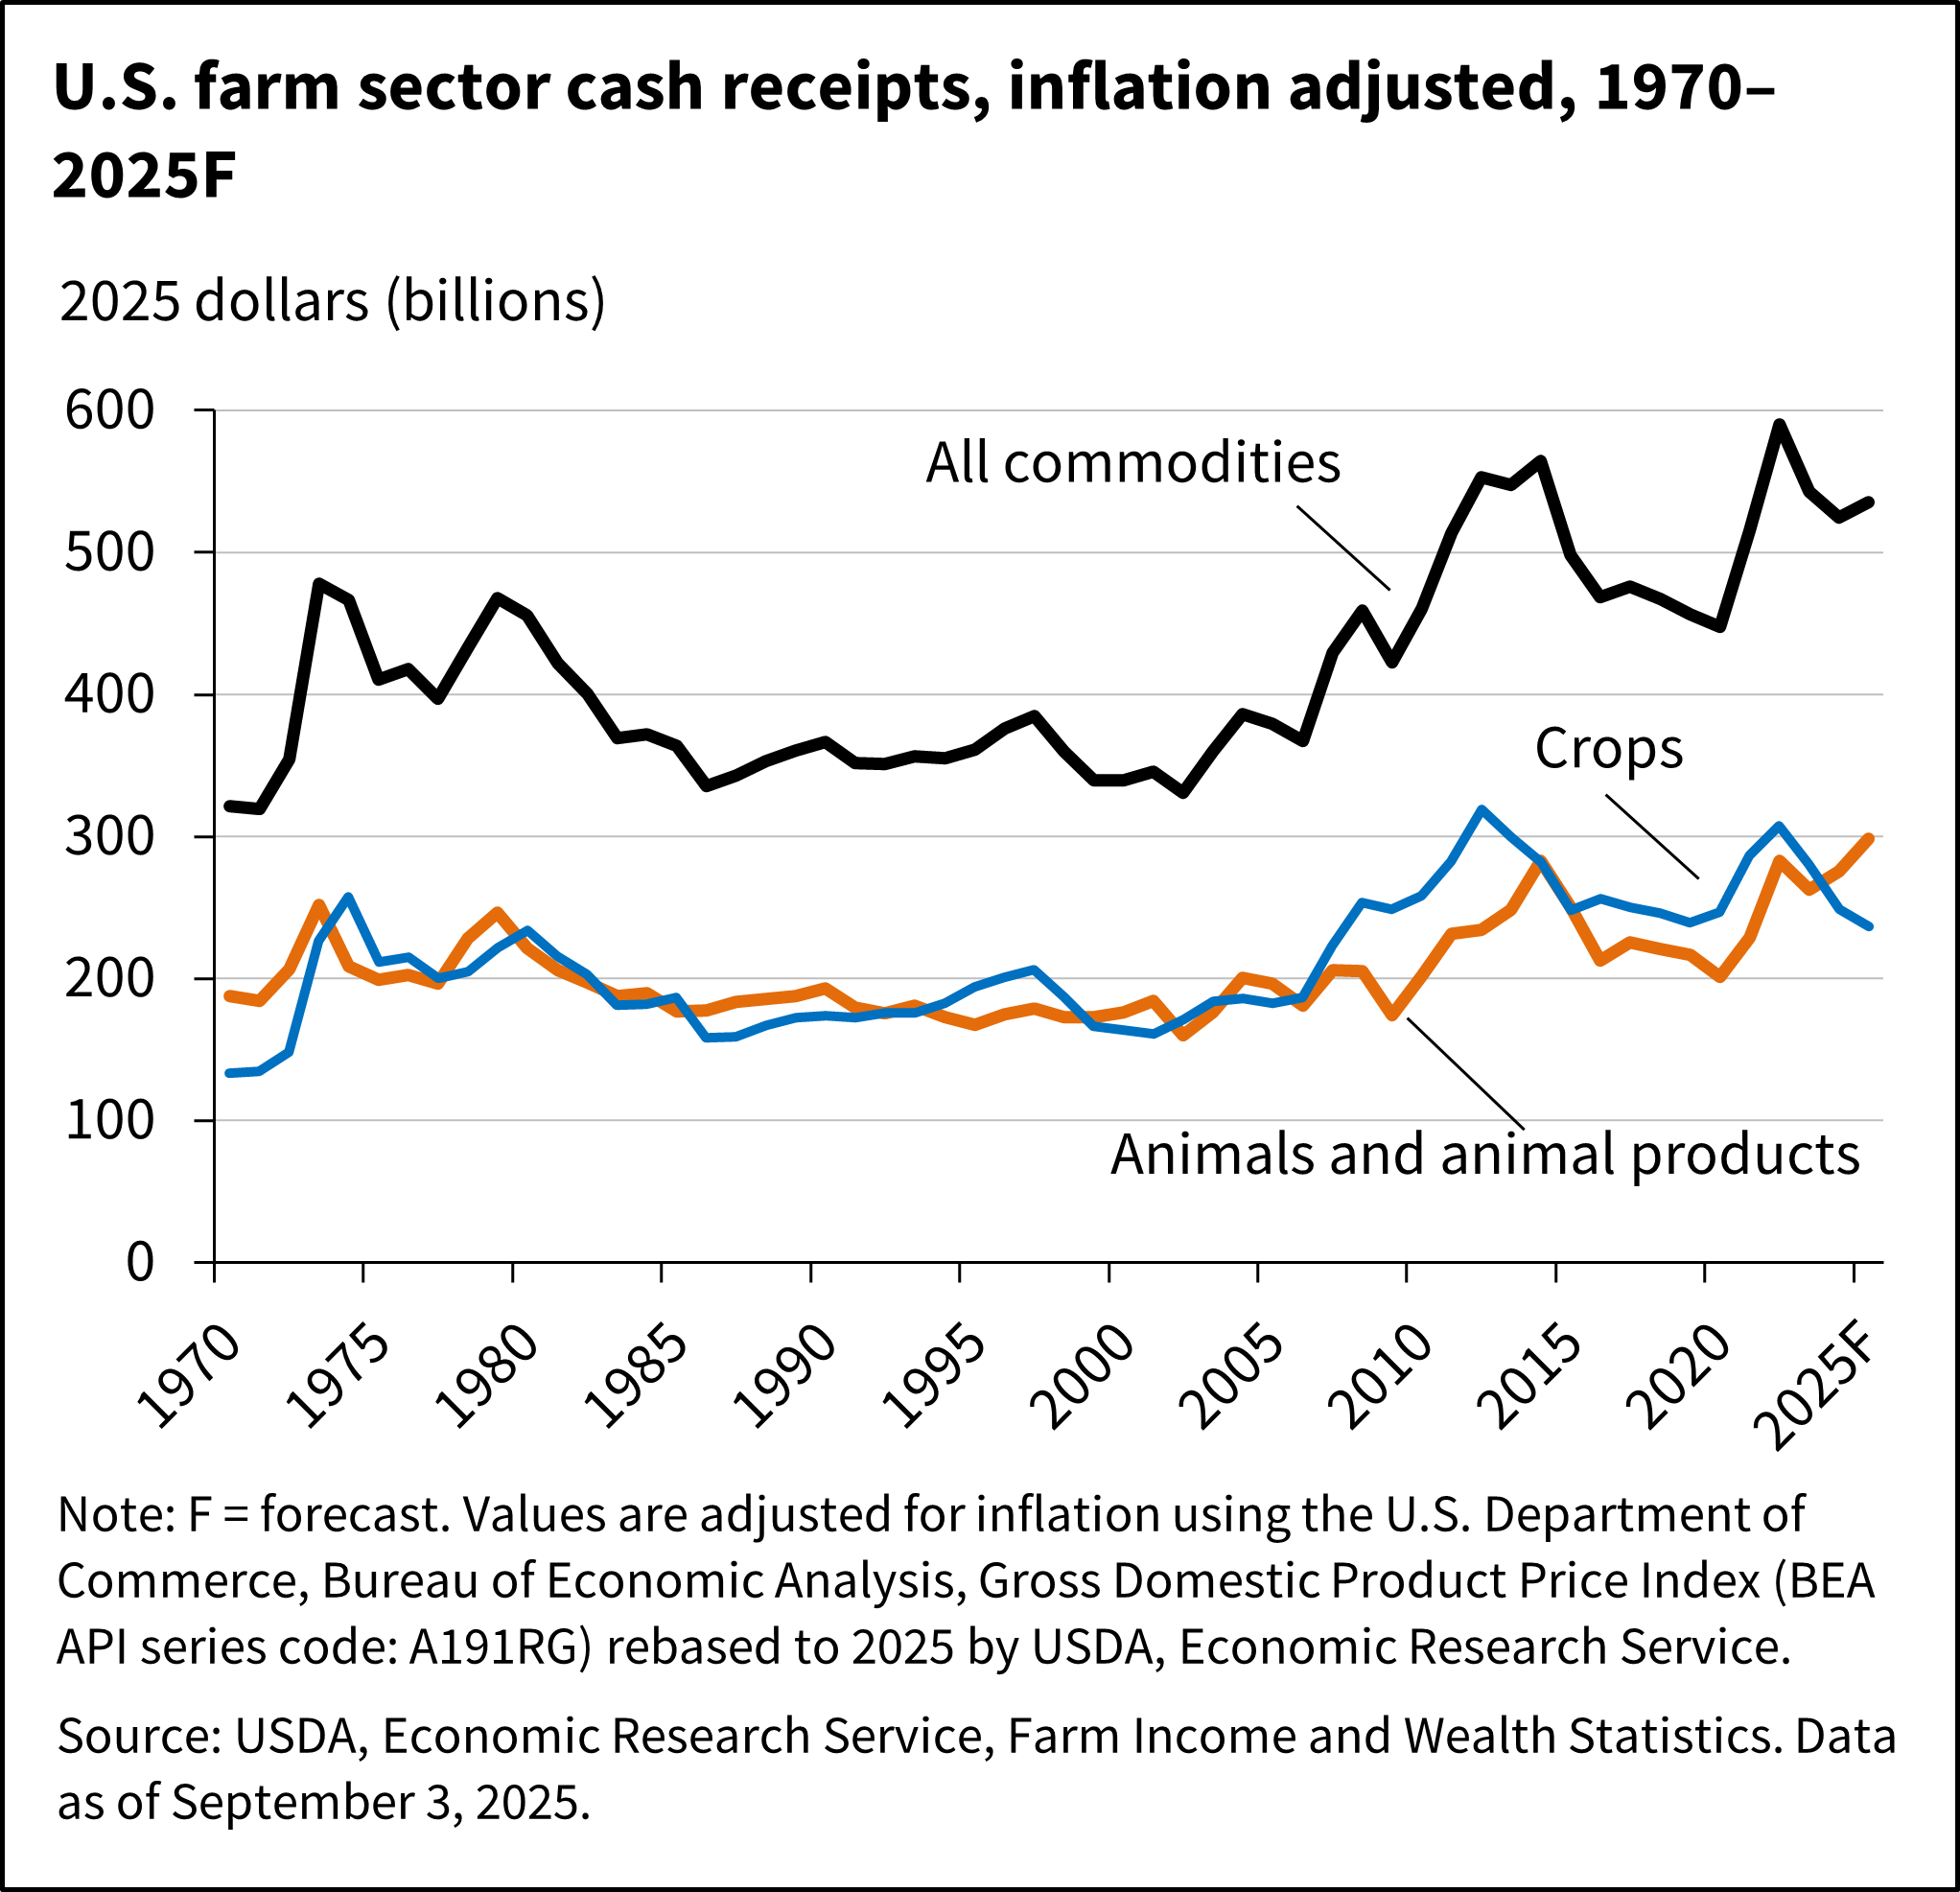
Farm cash receipts are forecast to increase by $24.0 billion (4.7 percent) from 2024 to $535.2 billion in 2025 in nominal dollars. Total crop receipts are forecast to decrease by $6.1 billion (2.5 percent) from 2024 levels to $236.6 billion in 2025 following lower receipts for soybeans, corn, and wheat. Conversely, total animal/animal product receipts are projected to increase by $30.0 billion (11.2 percent) to $298.6 billion in 2025.
We’d welcome your feedback!
Would you be willing to answer a few quick questions about your experience?