
Food spending in Washington, DC, differs from 50-State averages
- by Wilson Sinclair and Eliana Zeballos
- 5/24/2023
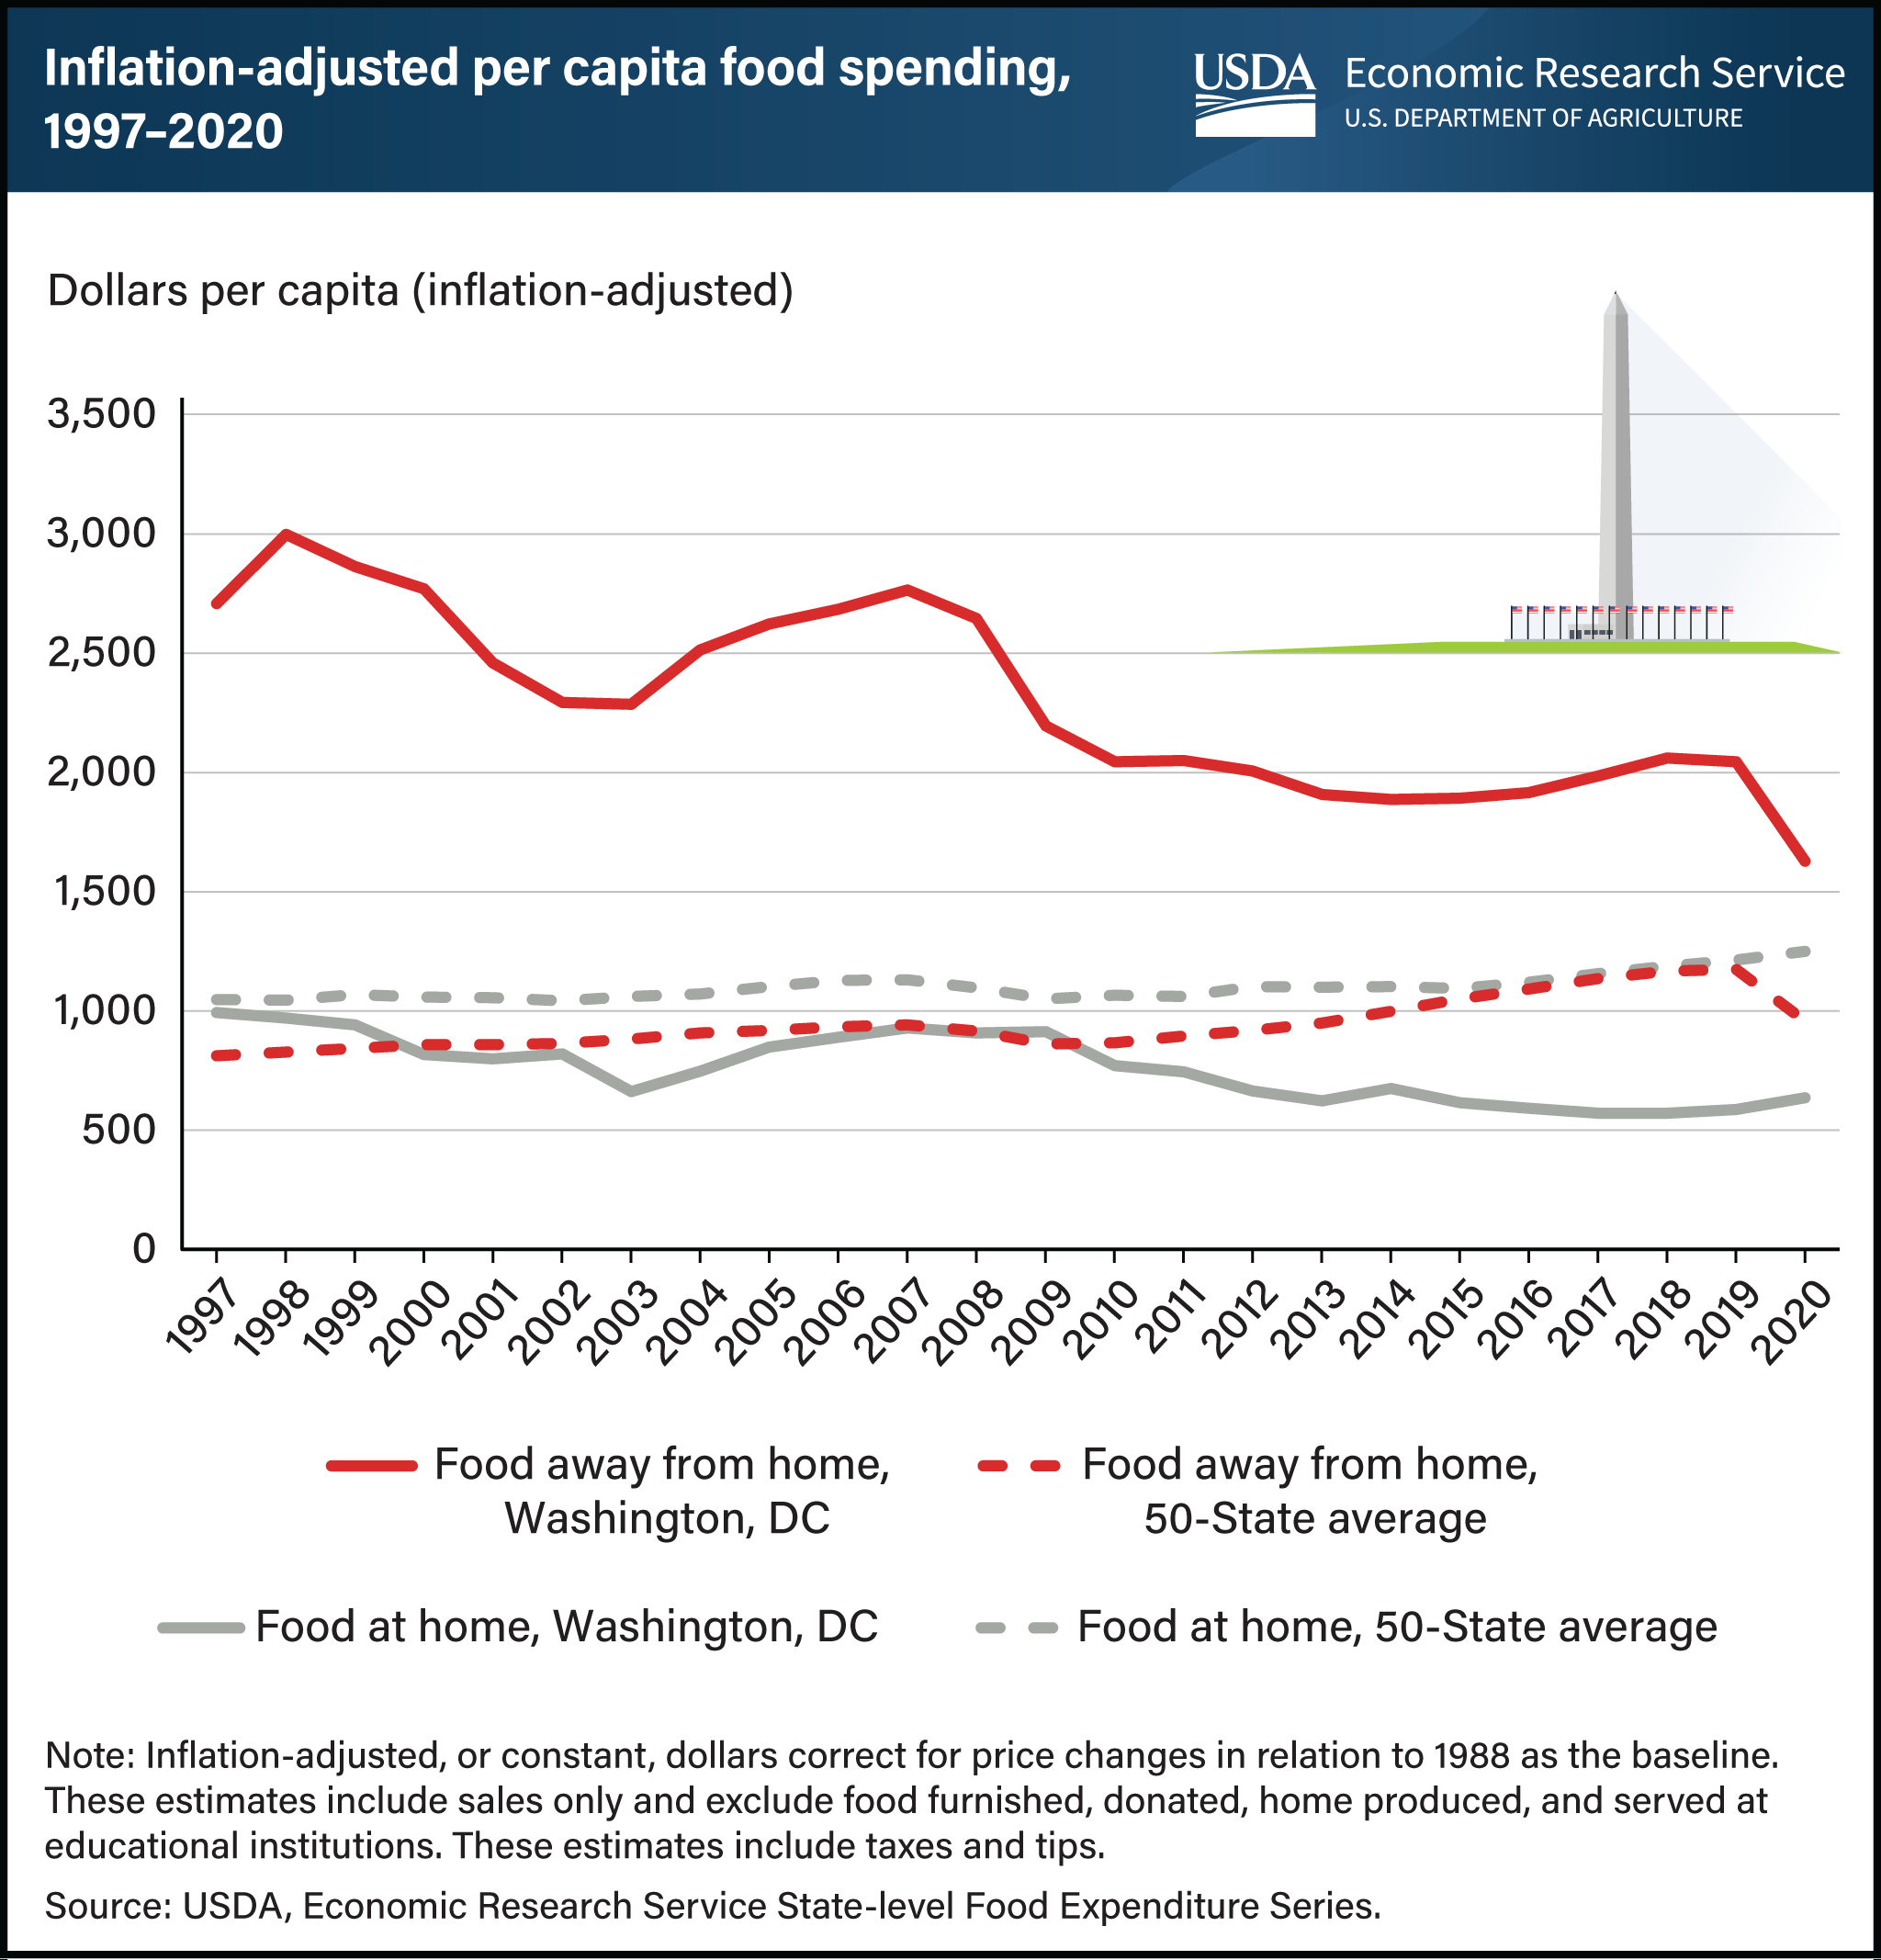
Food spending estimates for Washington, DC, differ widely from the 50-State average estimates. From 1997 to 2020, Washington, DC, had higher inflation-adjusted per capita sales at food-away-from-home (FAFH) establishments, such as restaurants, than the State average, although the gap narrowed over time. In 1997, FAFH spending in Washington, DC, was more than 3 times the 50-State average and 1.7 times the 50-State average in 2019 and 2020. The difference could be attributed to nonresident workers commuting into Washington, DC, and spending more at FAFH establishments. FAFH spending per capita in 2019 was 24 percent higher in Washington, DC, than in the highest State (Hawaii). Meanwhile, sales at food-at-home (FAH) outlets, such as grocery stores and supercenters, across the 50 States have steadily increased, with an average annual growth rate of 0.8 percent since 1997. However, FAH spending in Washington, DC, has been more volatile and has trended downward over time. Inflation-adjusted per capita spending on FAH in Washington, DC, was 40.8 percent lower in 2019 than in 1997, before increasing 8.2 percent in 2020 during the Coronavirus (COVID-19) pandemic. FAH spending in Washington, DC, was roughly equal to the 50-State average in 1997 but fell to approximately half the average from 2017 to 2020. FAH spending per capita in Washington, DC, in 2019 was 37 percent lower than the lowest State (Arkansas). This chart is drawn from the USDA, Economic Research Service’s State-level Food Expenditure Series, which launched in May 2023 and provides annual data on food spending for each State and Washington, DC, from 1997 to 2020.