

Food spending decreased unevenly across States in 2020
- by Wilson Sinclair and Eliana Zeballos
- 5/17/2023
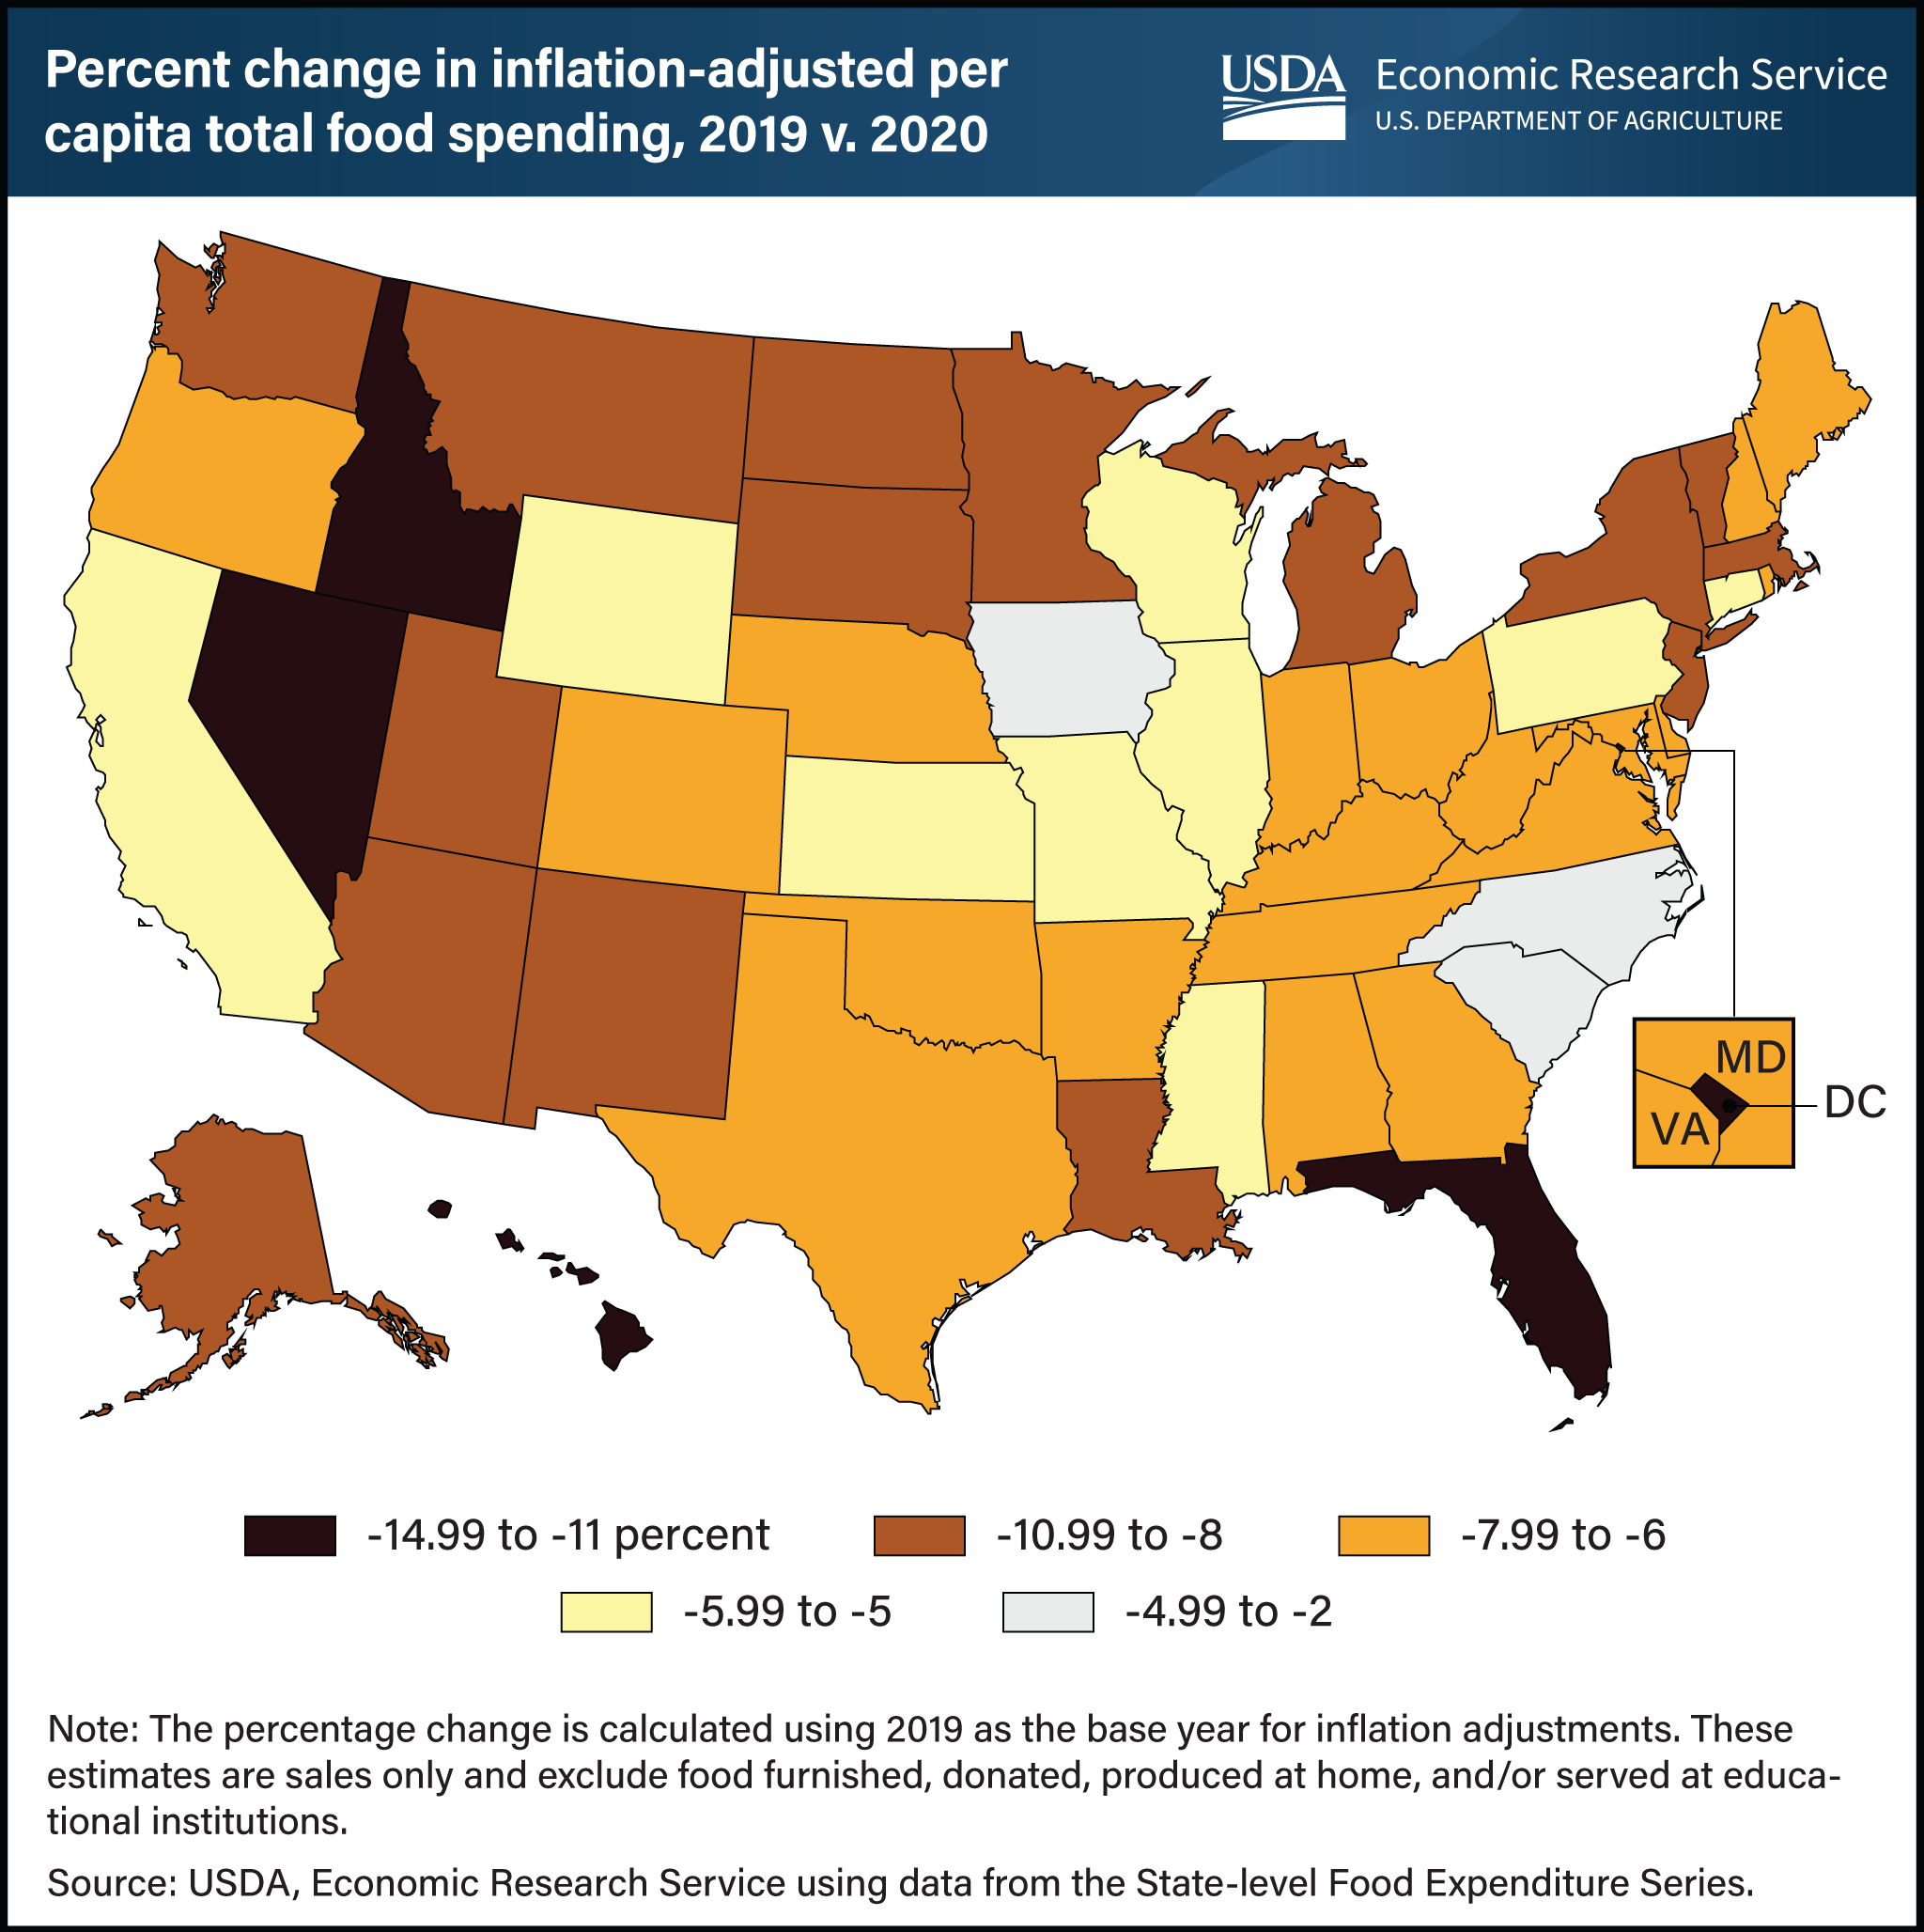
The Coronavirus (COVID-19) pandemic in the United States disrupted the food industry in 2020. Inflation-adjusted total U.S. food expenditures were 6.6 percent lower in 2020 than in 2019. However, individual States experienced varying degrees of food spending decline during this period. The USDA, Economic Research Service’s (ERS) newly developed State-level Food Expenditure Series helps to illustrate annual food spending changes across States since 1997, including Washington, DC. From 2019 to 2020, each State saw decreases in inflation-adjusted, per capita total food spending. The smallest decreases in food spending were in Iowa (2.2 percent), South Carolina (2.6 percent), and North Carolina (4.1 percent). The States that saw the largest decreases in inflation-adjusted, per-capita food spending were Hawaii (15 percent), Washington, DC (13.9 percent), Florida (11.8 percent), and Nevada (11.6 percent). These States typically have large out-of-State population inflows from nonresident workers and tourists. The median change of total food spending occurred in Delaware, with a decrease of 7.2 percent. These spending changes occurred as health concerns and mobility restrictions during the first year of the pandemic led consumers to spend less at restaurants and other eating out establishments in favor of relative cost-efficient outlets, such as grocery stores and supercenters. This chart is drawn from ERS’ State-level Food Expenditure Series, which launched in May 2023 and provides annual data on food spending for each State and Washington, DC, from 1997 to 2020.