
Ratios of 2017–2018 nutrient, food component, and food equivalent density to the recommended density among U.S. consumers aged 2 and above
- by Biing-Hwan Lin and Joanne Guthrie
- 8/21/2024
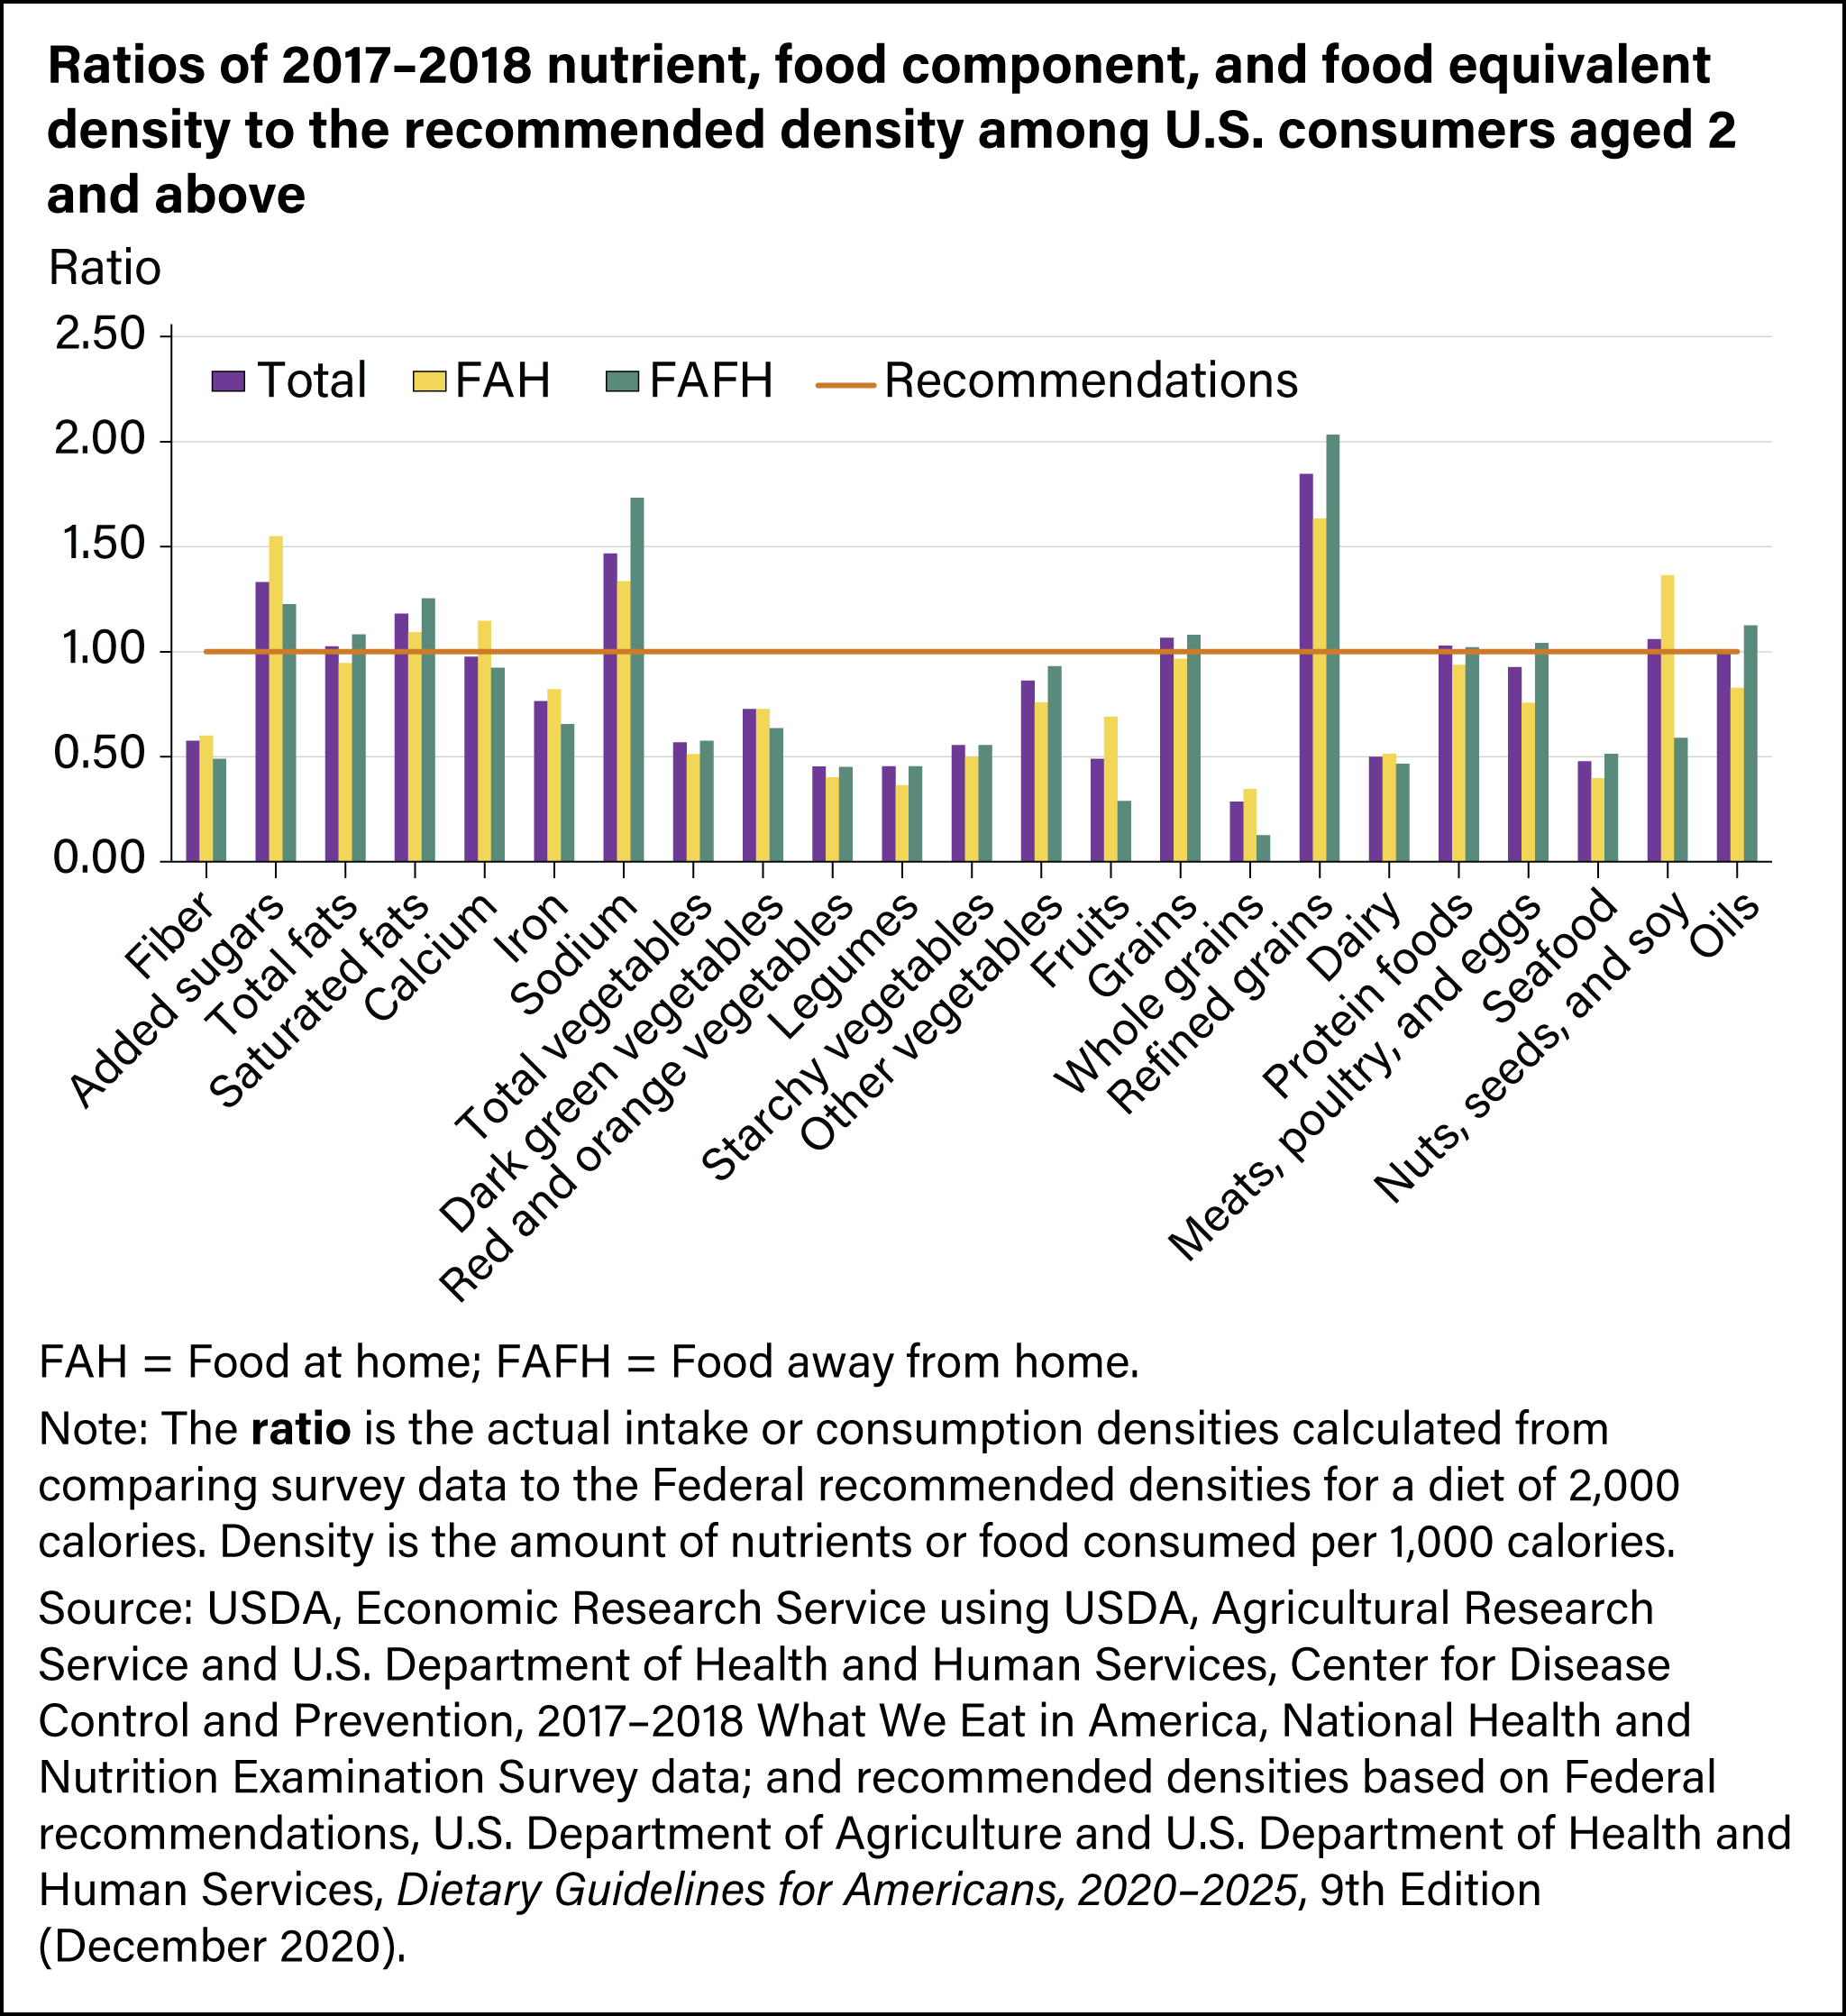
U.S. consumers’ diets fall short of the 2020–2025 Dietary Guidelines for Americans recommendations by substantial margins, except for total fats, calcium, most of the protein foods, and oils. Of the 23 densities analyzed using 2017–2018 data, researchers found 16 deviated from their recommended levels by more than 20 percent including fiber, added sugars, saturated fats, iron, sodium, total vegetables, dark green vegetables, red and orange color vegetables, starchy vegetables, legumes, other vegetables, fruits, whole grains, refined grains, dairy, and seafood intake densities.
We’d welcome your feedback!
Would you be willing to answer a few quick questions about your experience?