

U.S. production of beet sugar and cane sugar by State, 2001/02–2022/23
- by Vidalina Abadam
- 2/14/2023
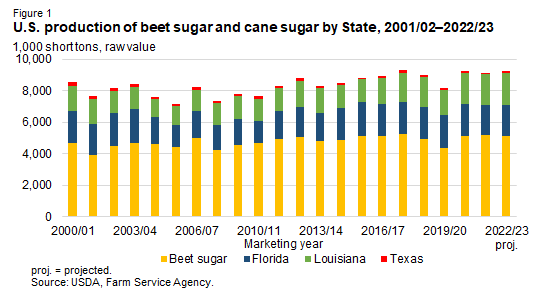
Bar chart of U.S. production of beet sugar and cane sugar by State, 2001/02–2022/23
Official websites use .gov
A .gov website belongs to an official government organization in the United States.
Secure .gov websites use HTTPS
A lock (
) or https:// means you’ve safely connected to the .gov website. Share sensitive information only on official, secure websites.
Bar chart of U.S. production of beet sugar and cane sugar by State, 2001/02–2022/23