

Race and ethnicity of rural labor force vary by industry
- by James C. Davis
- 2/1/2023
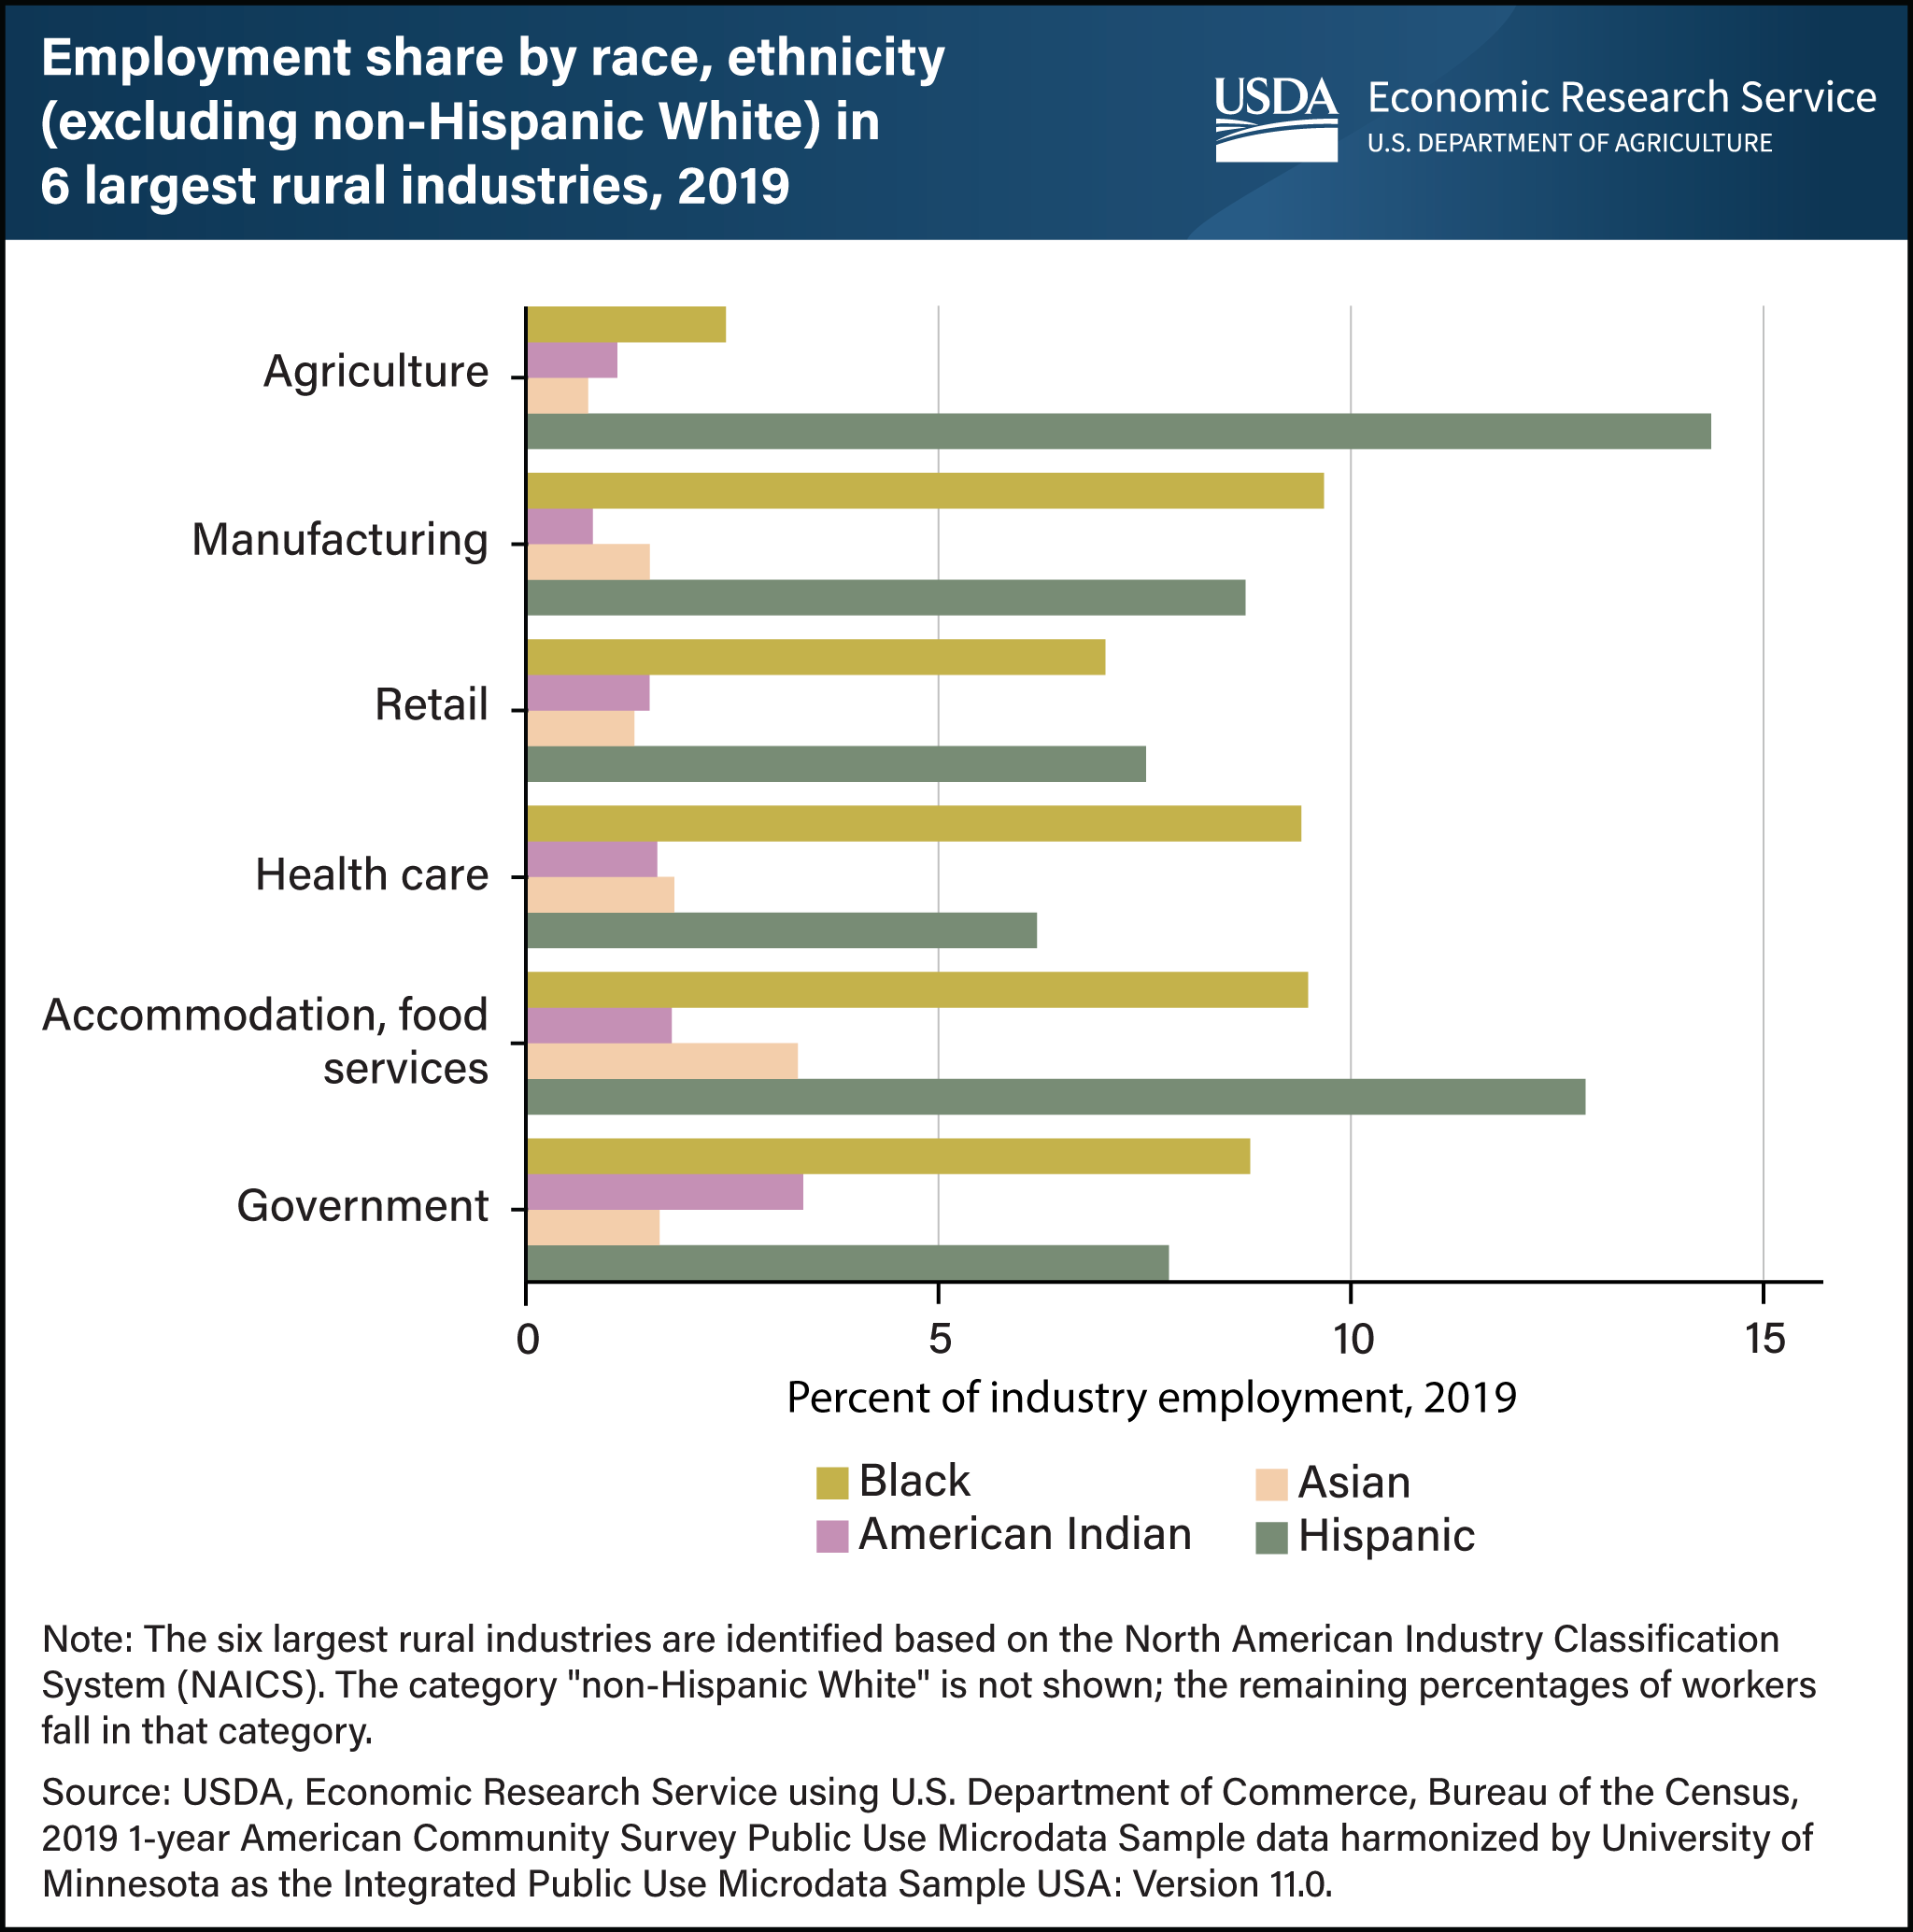
Among racial and ethnic groups (not including non-Hispanic White) in rural areas, Hispanic workers often lead employment in the six largest rural industries. In 2019, Hispanic workers performed 14.4 percent of rural jobs in agriculture and 12.8 percent in accommodation and food services. In rural manufacturing jobs, 8.7 percent of workers were Hispanic; in government, 7.8 percent; in retail, 7.5 percent; and in health care and social assistance, 6.2 percent. Rural Black workers were more evenly distributed with 9.7 percent of the workforce in manufacturing, 9.4 percent in health care and social assistance, 9.5 percent in hotels and restaurants, and 8.8 percent in government. Black workers were less represented in retail (7.0 percent) and in agriculture (2.4 percent). Asian workers constituted less than 2 percent of the rural workforce in most industries, except for accommodation and food services (3.3 percent). Similarly, American Indian or Alaska Native workers represented less than 2 percent of rural employment in most industries except government (3.4 percent). This chart appears in the USDA, Economic Research Service report Rural America at a Glance: 2022 edition.