
Number of U.S. hog operations declined between 1997 and 2017, while farm size and contract production increased
- by LaPorchia A. Collins and Christopher G. Davis
- 12/9/2022
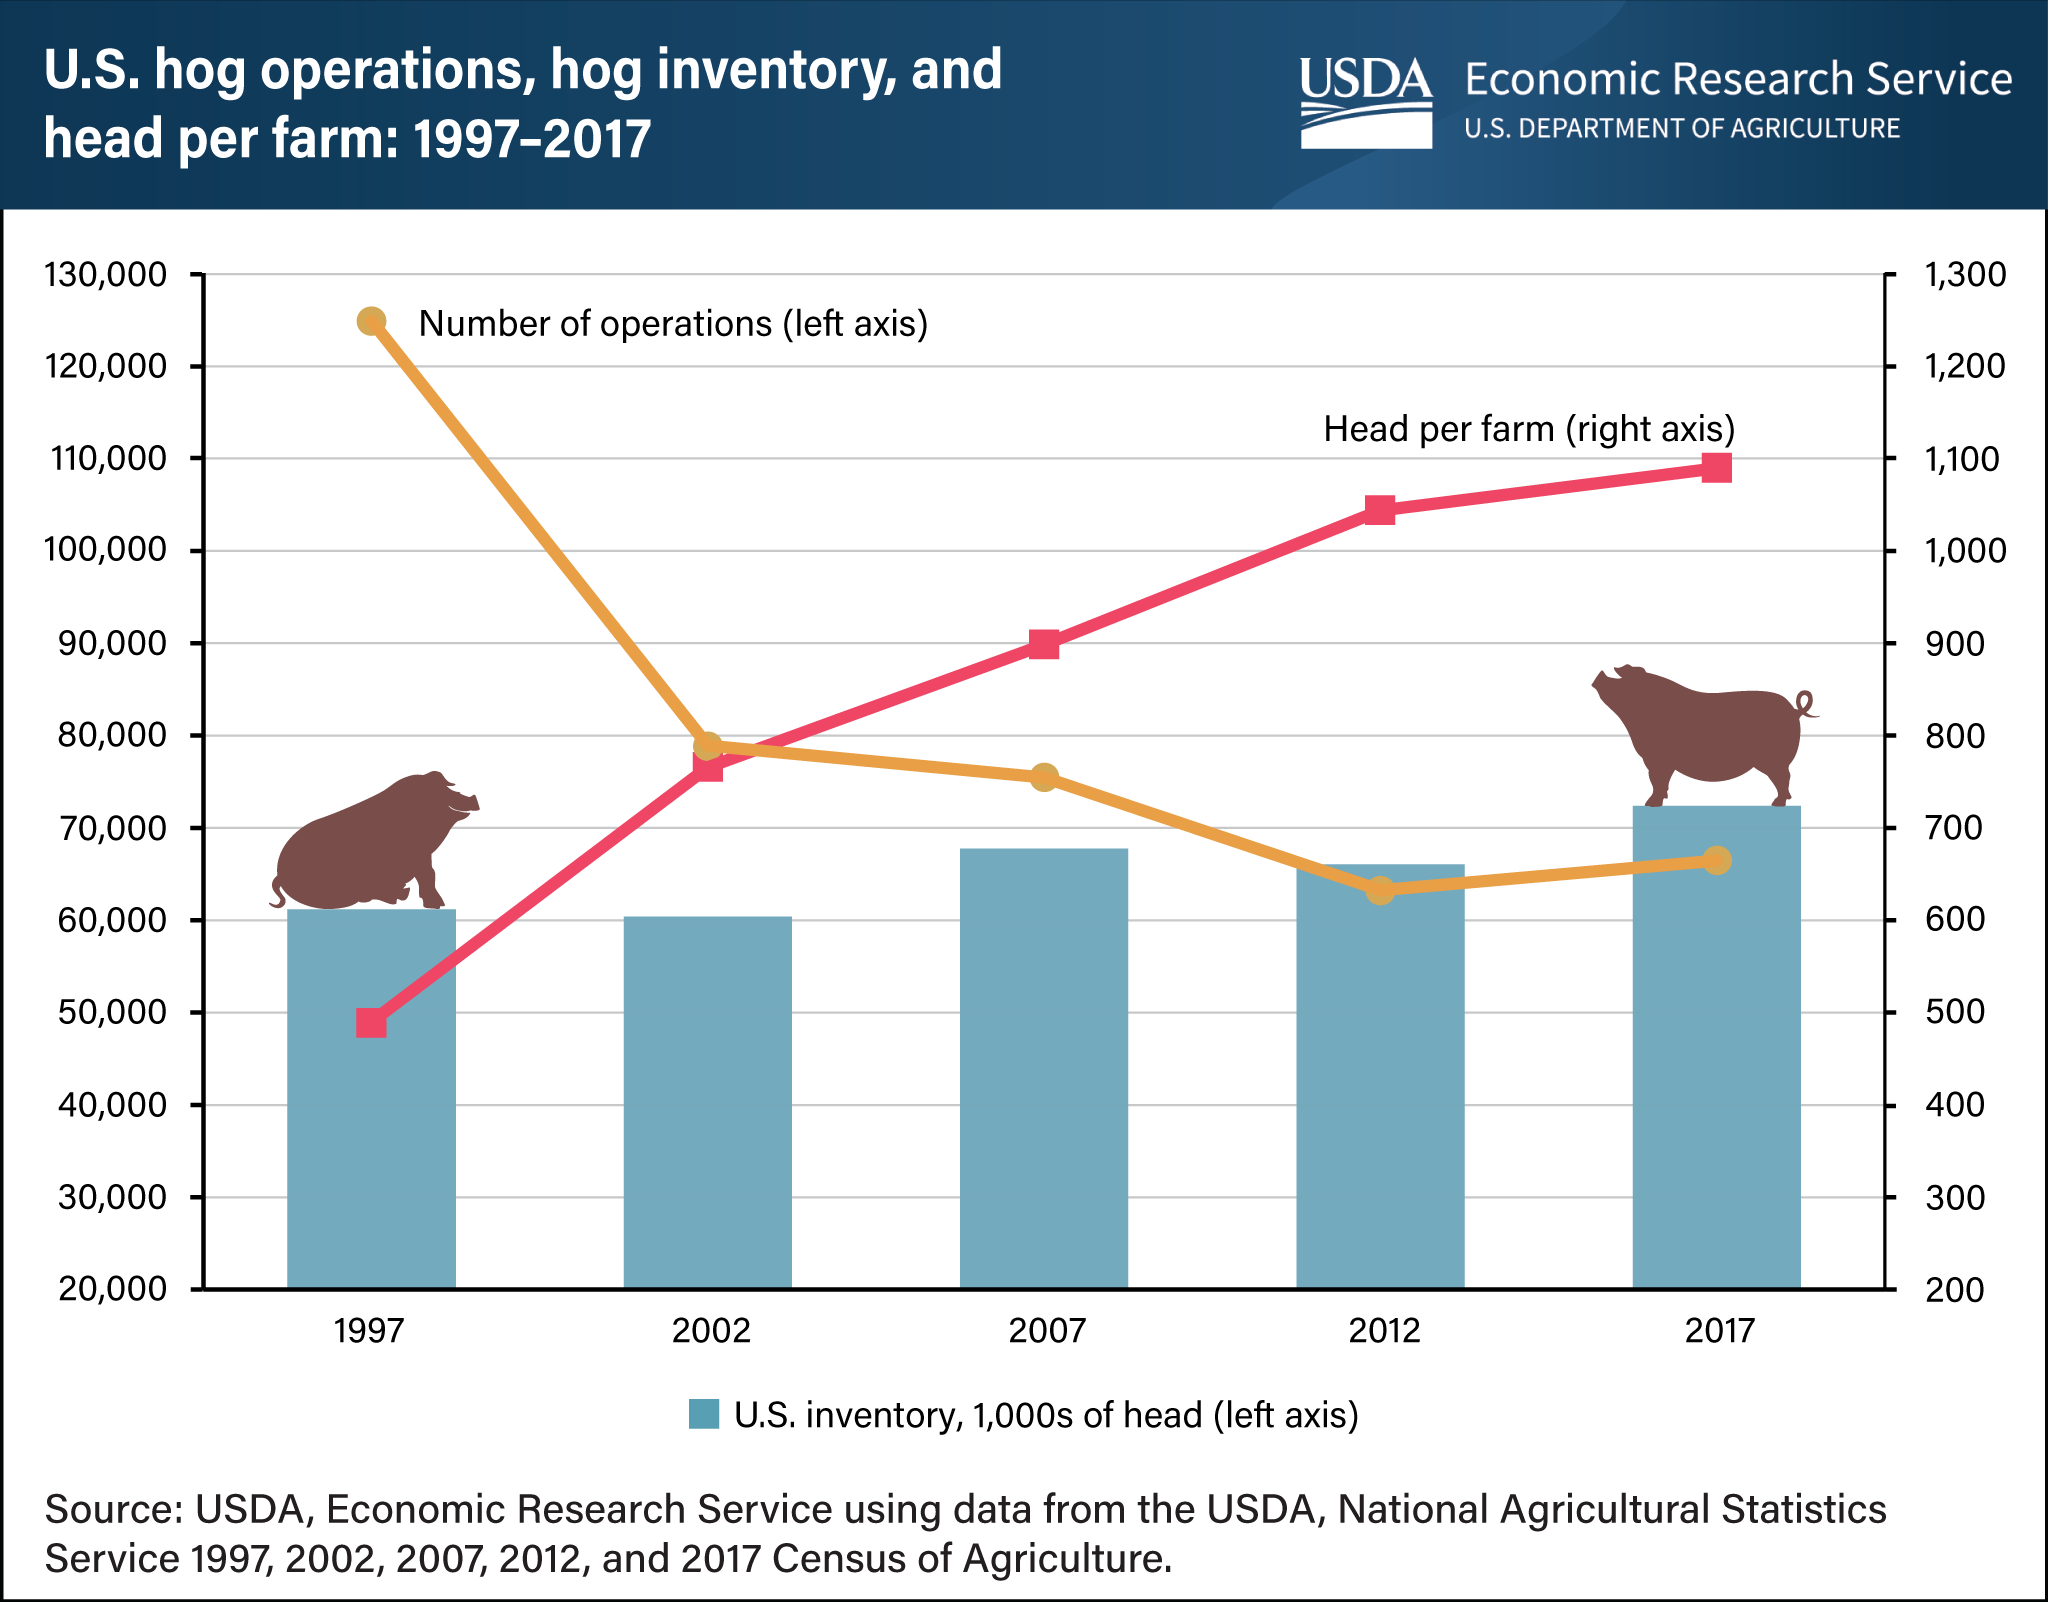
The structure of the U.S. hog sector changed between 1997 and 2017, shifting hog production to fewer, but larger, farms. According to data from the Census of Agriculture, which is administered by the USDA, National Agricultural Statistics Service, the number of hog operations with inventory declined 37 percent between 1997 and 2002 and continued to drop through 2012. Despite ticking upward in 2017, the number of operations with inventory ended at roughly 66,000 operations, 47 percent less than in 1997. In contrast, the average farm size roughly doubled over those two decades, as measured by the number of head of hogs in inventory per farm. The share of the U.S. hog inventory on farms with 5,000 or more head rose from 40 percent in 1997 to 73 percent in 2017. Overall, the U.S. hog inventory increased by 18 percent over the period, and the average hog farm size rose to more than 1,000 head of hogs. Reductions in the number of hog operations and increases in hog farm size have occurred alongside increases in production contract use. For example, by 2017, the percentage of hogs sold under a production contract rose to more than 50 percent in Iowa and Minnesota (combined) and in North Carolina, three hog-producing States that together contributed to more than half the hogs sold in the United States. From 2012 to 2017, contract production rose from 51 to 59 percent in Iowa and Minnesota and from 83 to 91 percent in North Carolina. This chart appears in the USDA, Economic Research Service report U.S. Hog Production: Rising Output and Changing Trends in Productivity Growth, published in August 2022.