
Average annual growth in total factor productivity varied by country and region from 1991 to 2020
- by Stephen Morgan, Keith Fuglie and Jeremy Jelliffe
- 12/5/2022
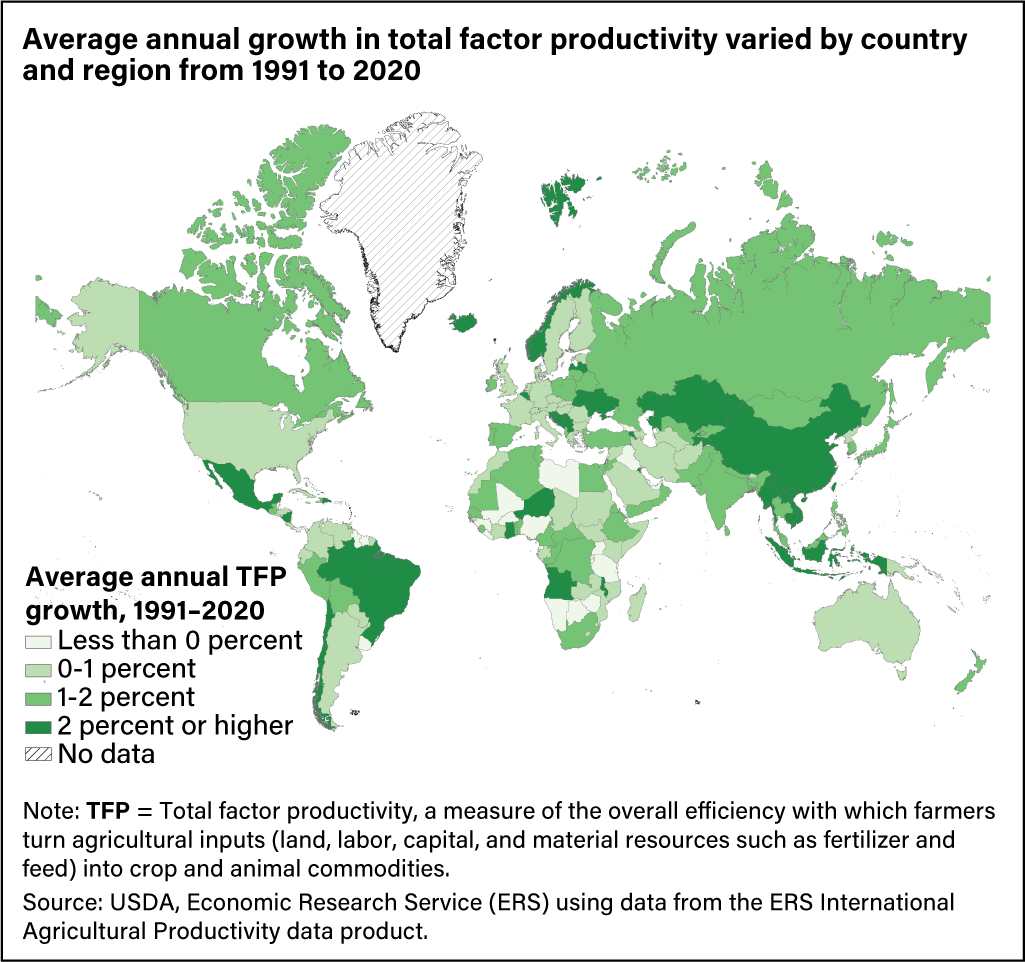
Map of the world showing rates of annual total factor productivity growth from 1991 to 2020.