

Global agricultural output growth rate slowed over the past decade along with declines in agricultural productivity growth
- by Stephen Morgan, Keith Fuglie and Jeremy Jelliffe
- 12/5/2022
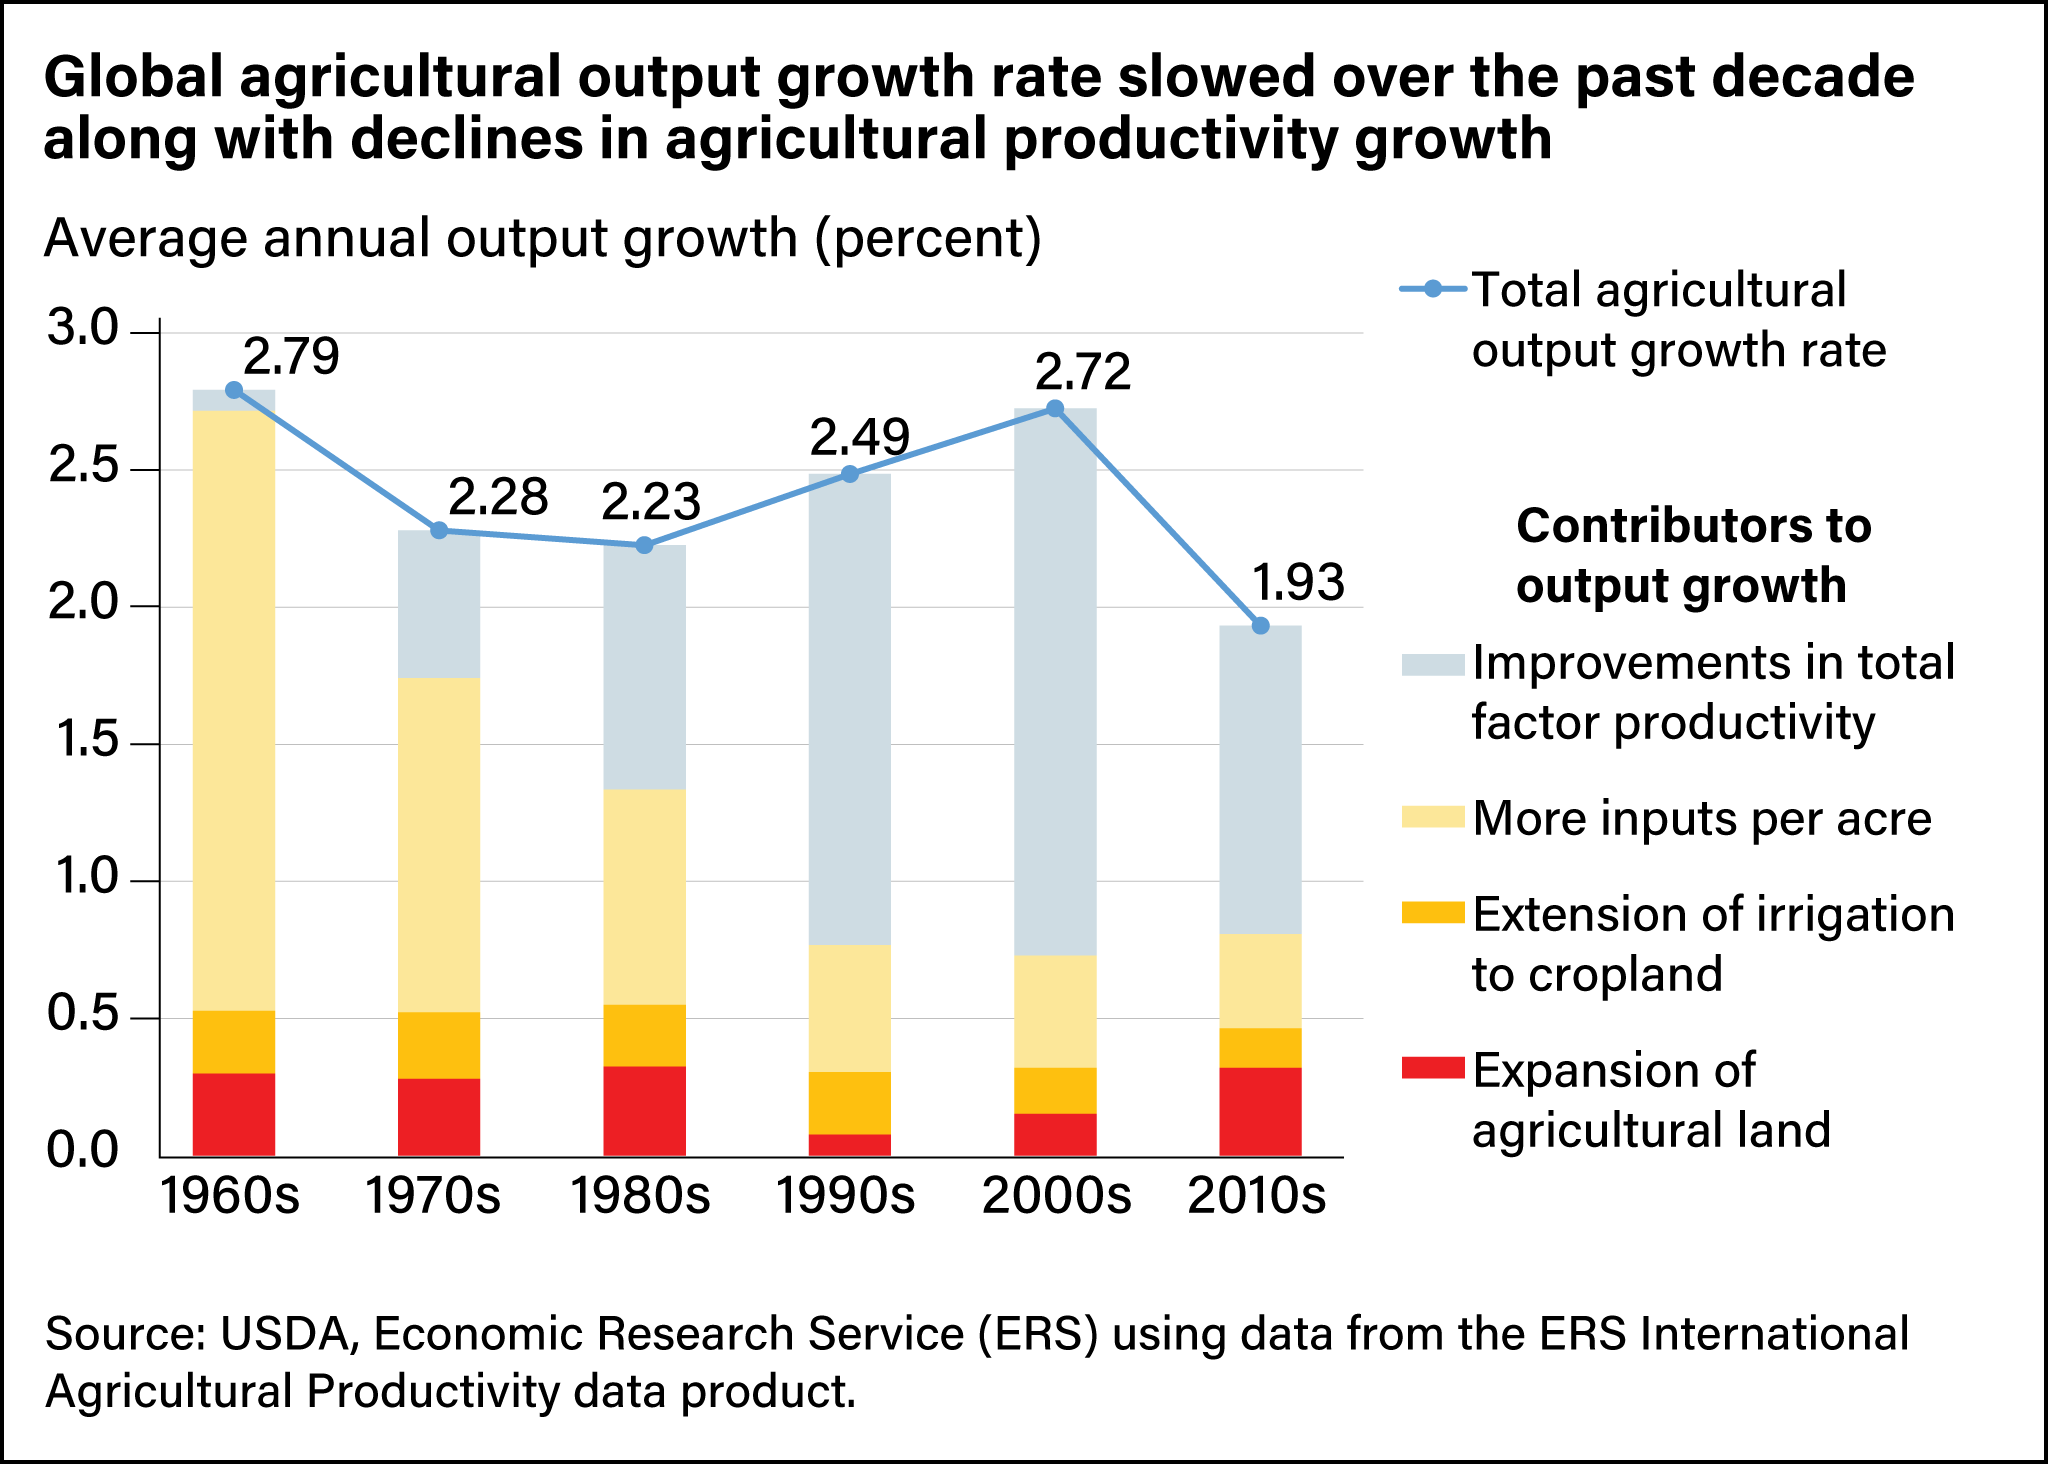
Combination line and stacked bar chart showing the rate of global agricultural output growth in the decades from the 1960s to the 2010s and the contributors to global output growth in those decades.