

Many American Indians and Alaska Natives are concentrated in high poverty rural areas
- by Tracey Farrigan
- 11/25/2022
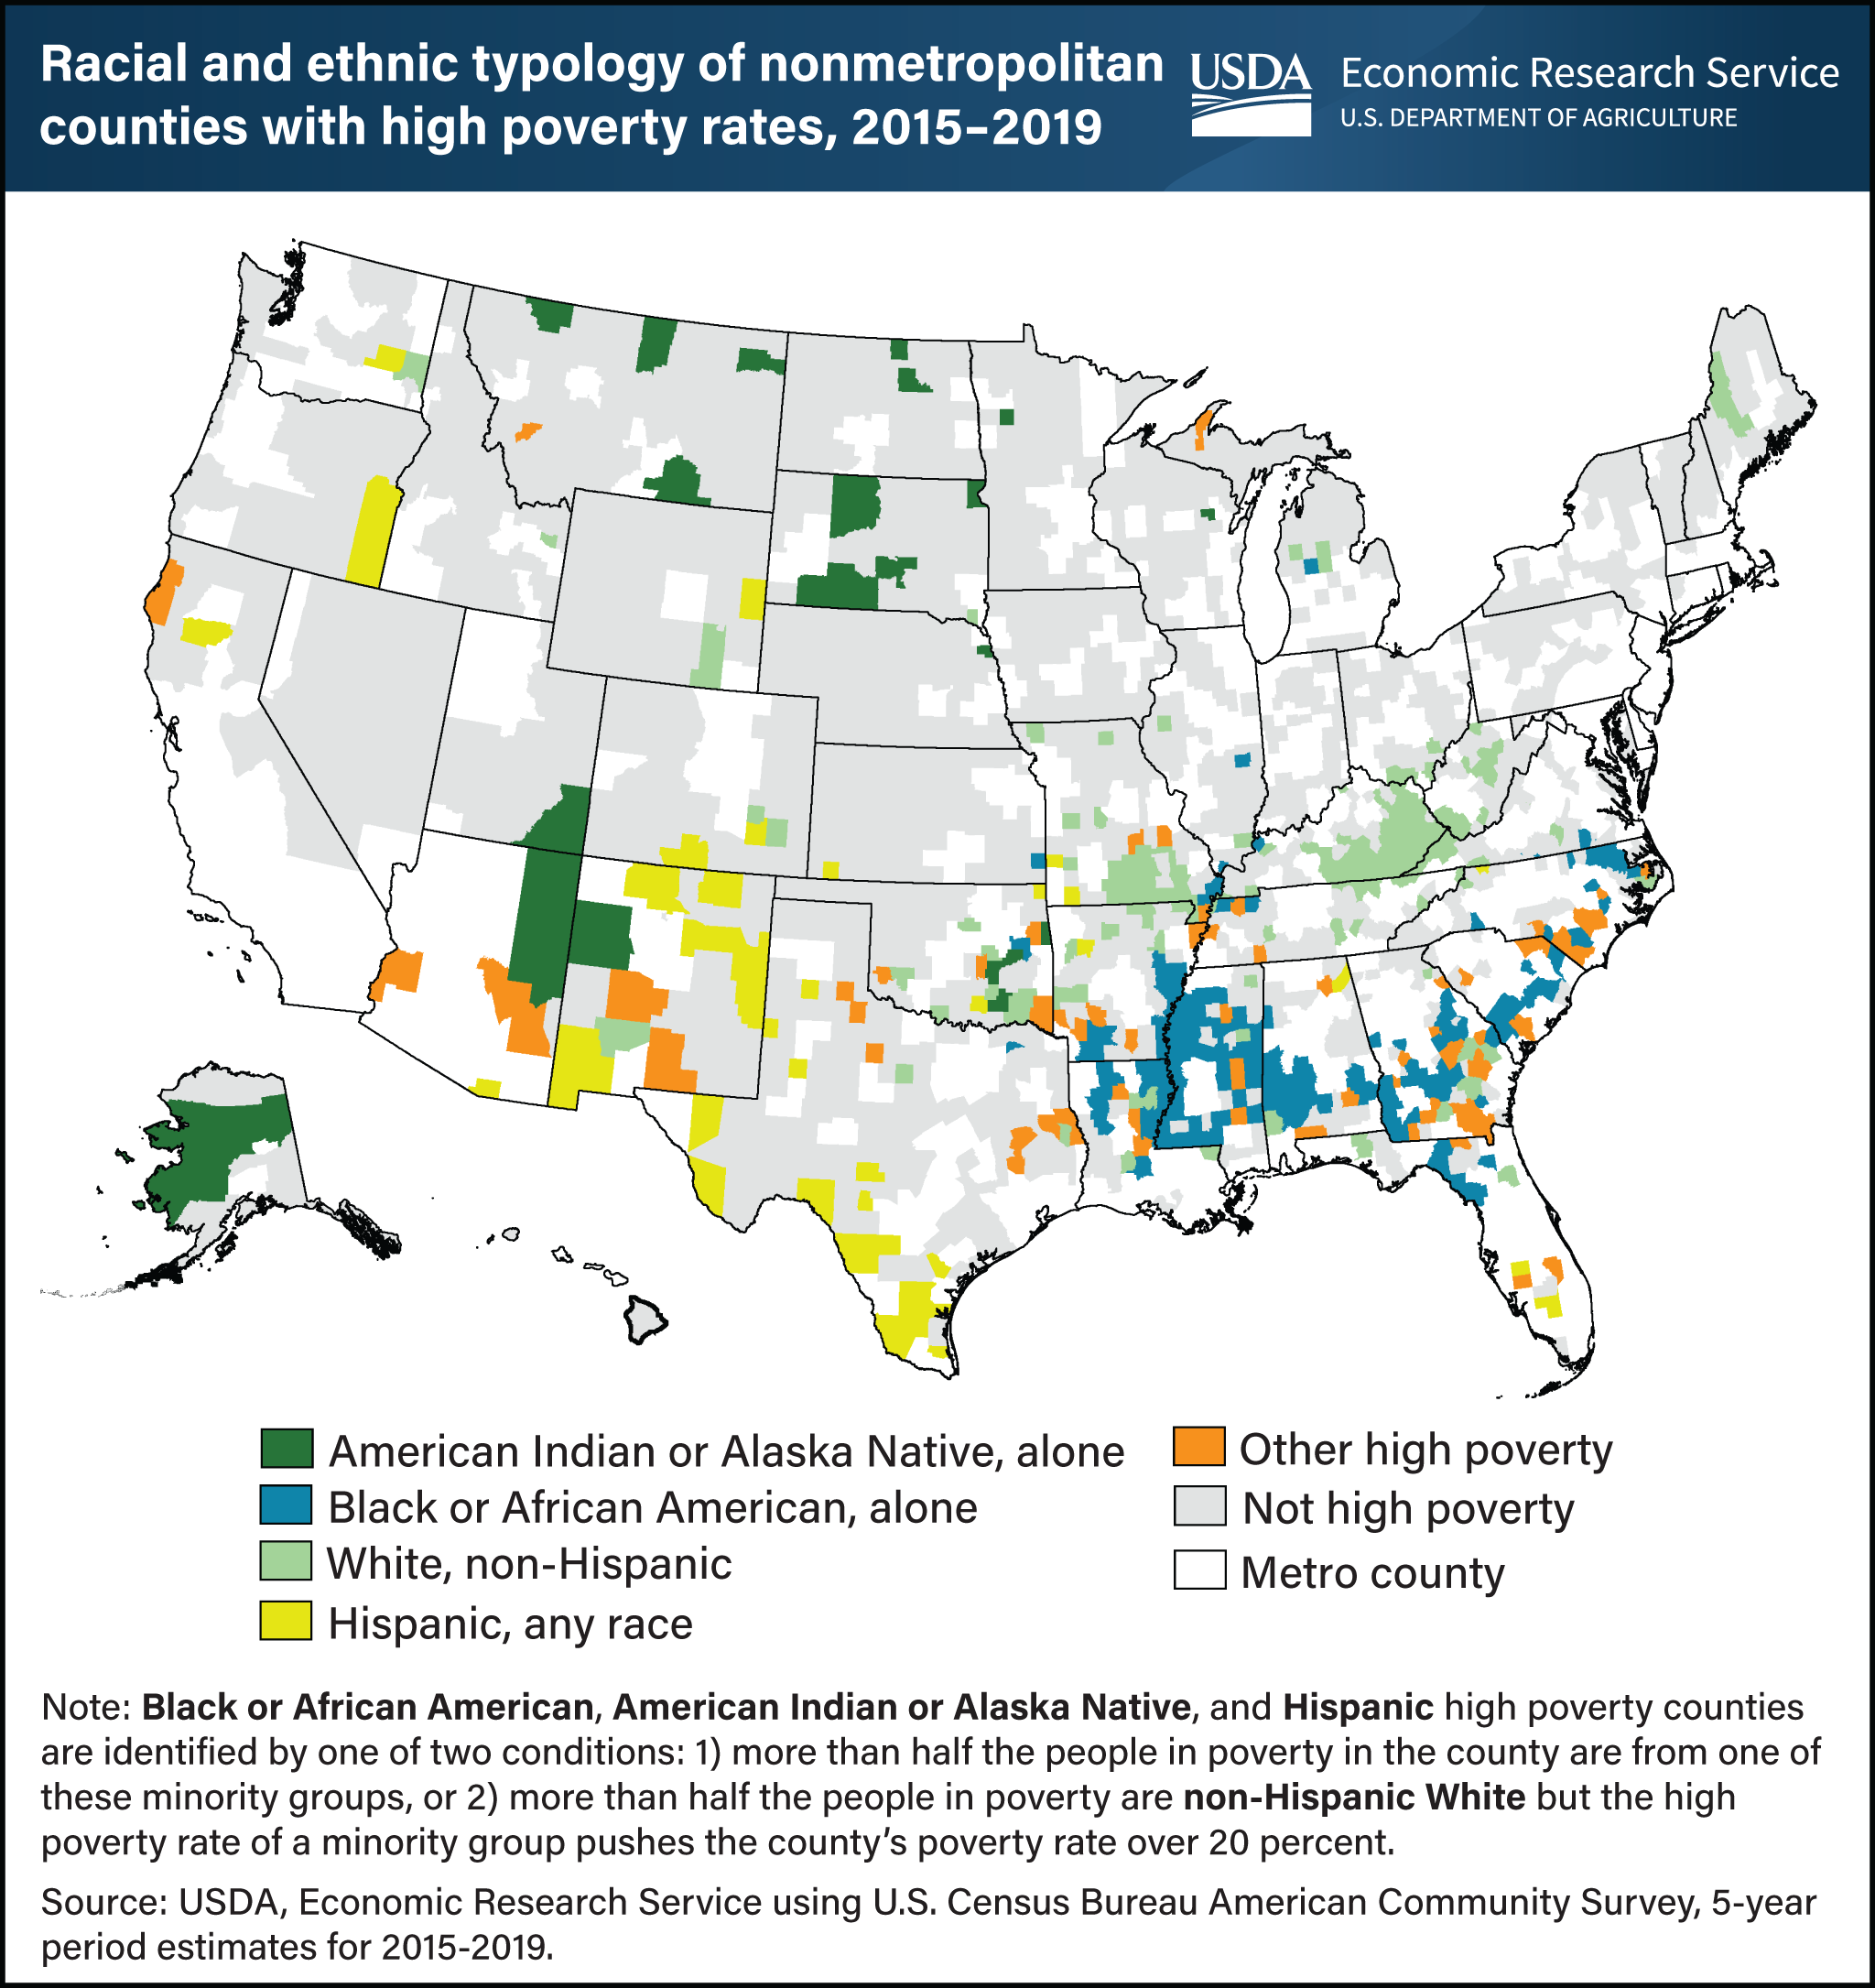
According to U.S. Census Bureau estimates for 2015-19, there were 469 nonmetropolitan (nonmetro) counties with a poverty rate of 20 percent or more, which USDA, Economic Research Service (ERS) designates as high poverty. The high poverty classification in more than half of the counties (236) is characterized by a concentration of poverty within racial and ethnic minority groups, including Black or African American (153 counties), Hispanic (49 counties) and American Indian and Alaska Natives (34 counties). Many of the American Indian and Alaska Native high poverty counties are areas of historic tribal presence or were designated as reservation settlements in the 19th century. The average poverty rate for those 34 counties is 31.5 percent for the total population and 40.5 percent for the American Indian and Alaska Native population alone, a level considered to be extreme poverty. The average poverty rates for the other racial-ethnic high poverty county types are below 30 percent for the total population and below 40 percent for the Black or African American and Hispanic population groups. This chart uses information from the ERS Atlas of Rural and Small-Town America to update information on the Rural Poverty and Well-being topic page and the Amber Waves feature Anatomy of Nonmetro High-Poverty Areas: Common in Plight, Distinctive in Nature, published in February 2004.