

Thanksgiving is filled with food activities, while non-food shopping is popular on Black Friday
- by Brandon J. Restrepo and Eliana Zeballos
- 11/17/2022
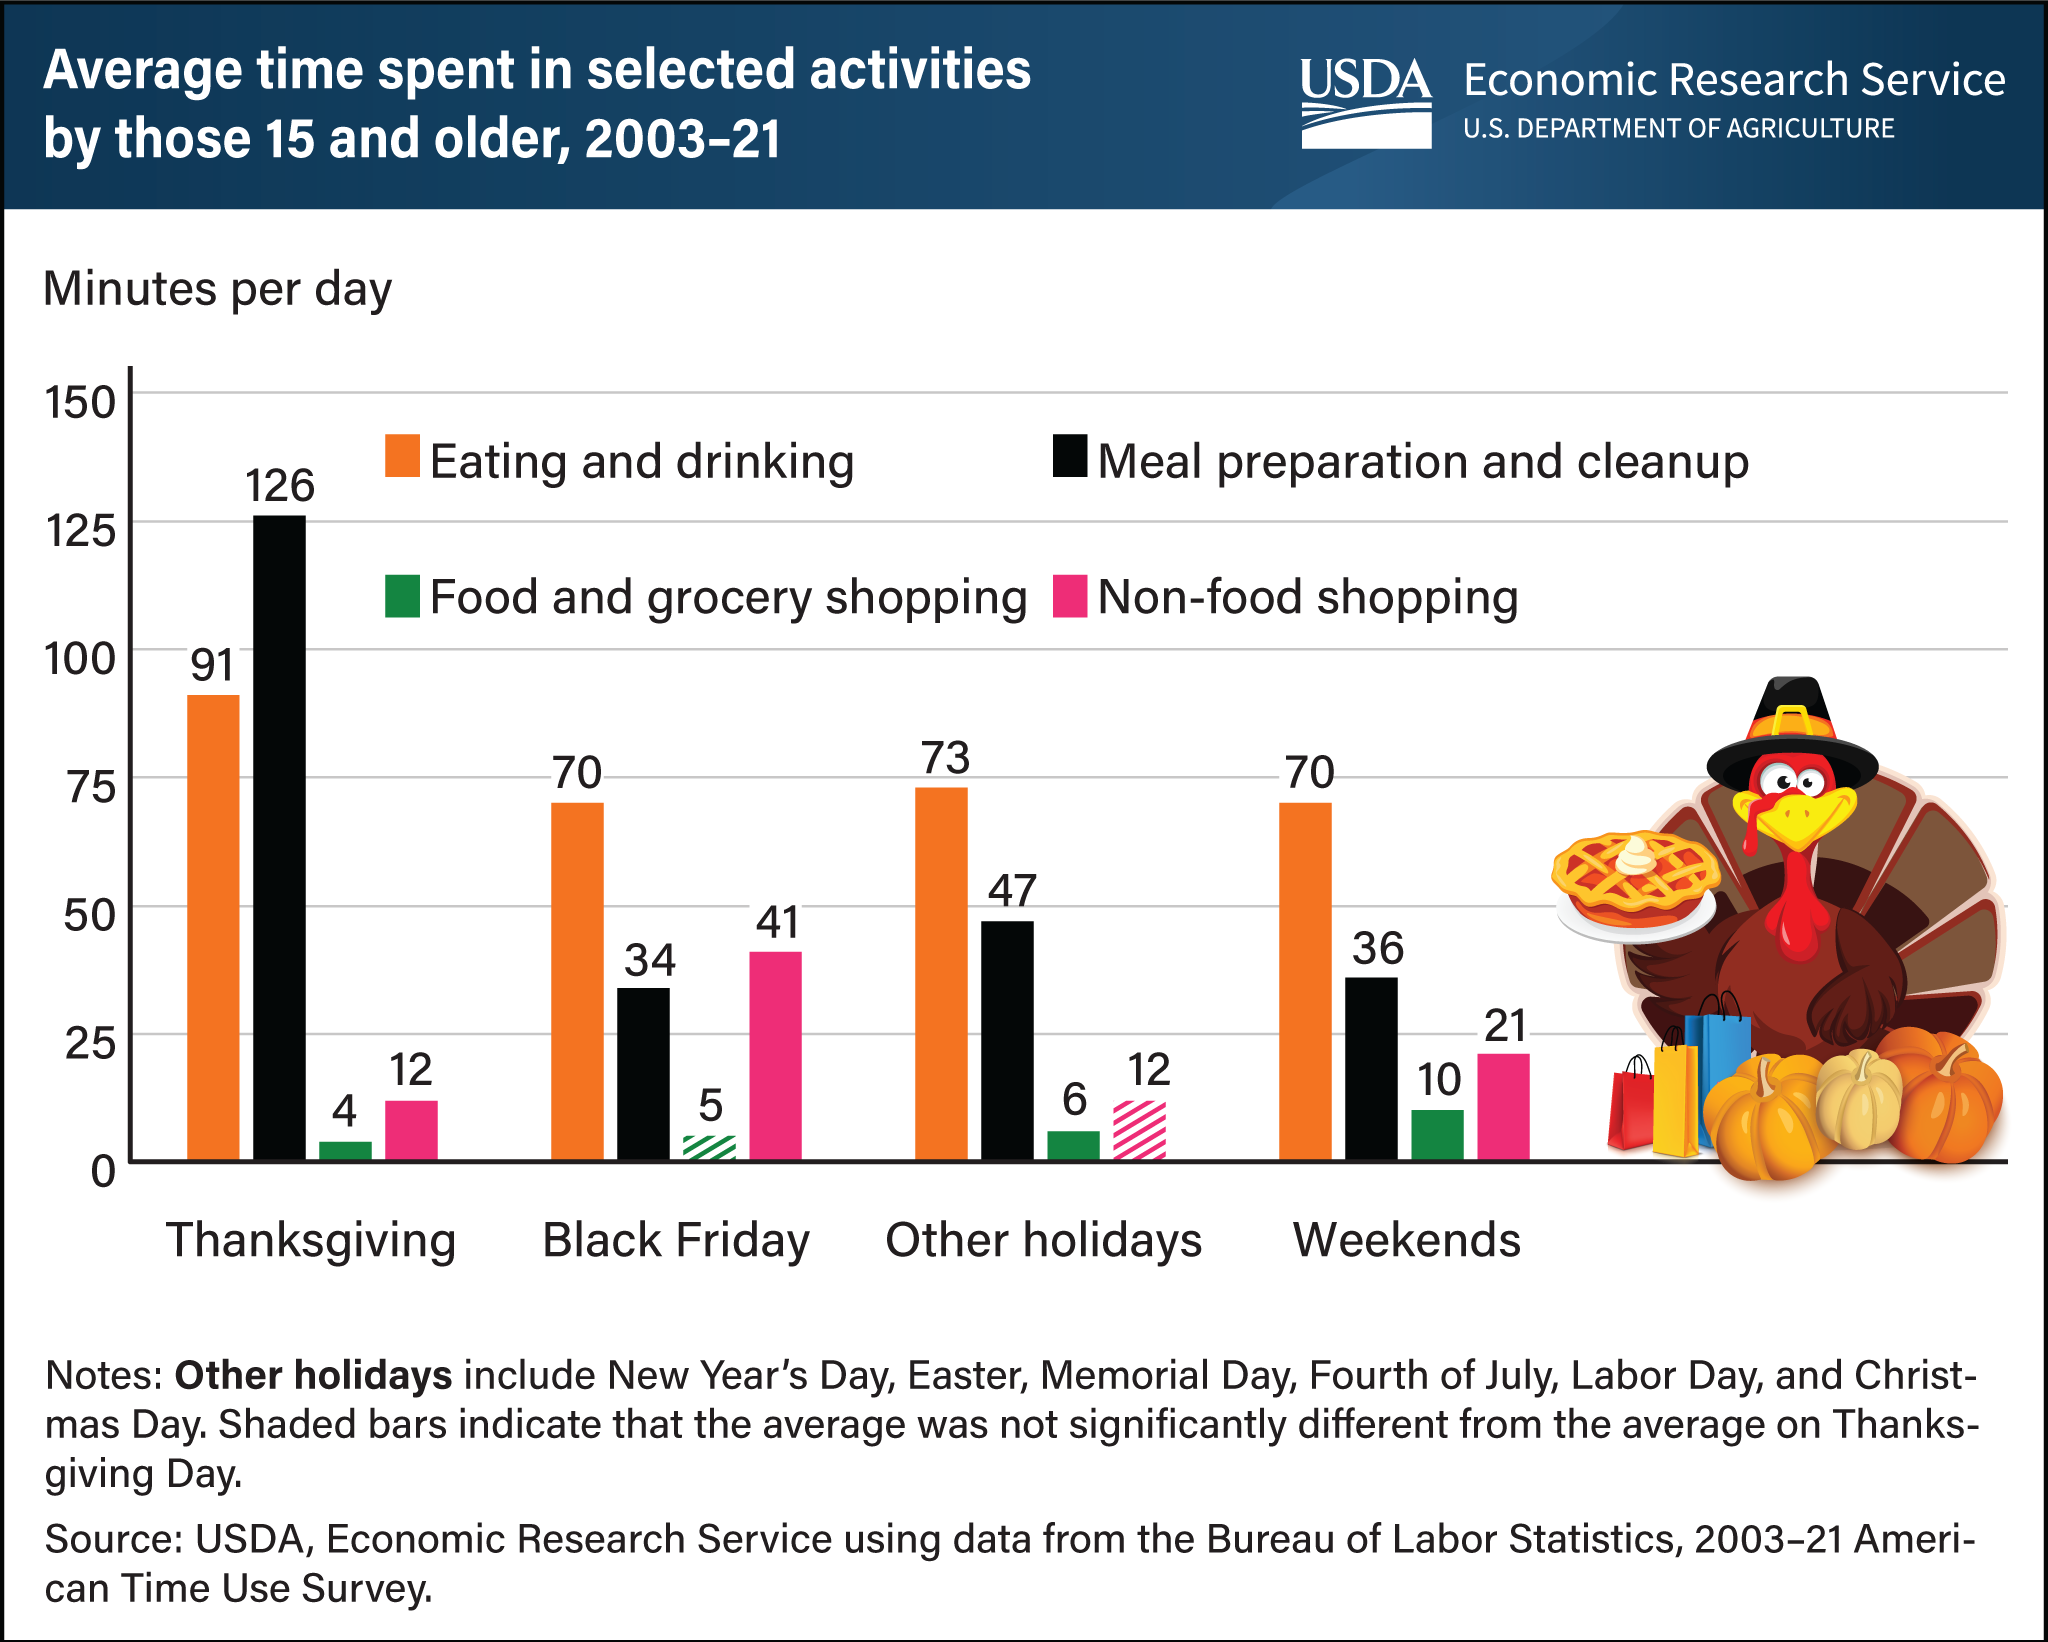
Do people really spend more time preparing food, eating, drinking, and cleaning up the kitchen on Thanksgiving Day compared with other holidays? Do they really spend more time shopping on Black Friday than on other days? The answer to both questions is “Yes.” Over a survey period from 2003 to 2021, people in the United States spent an average of 91 minutes eating and drinking on Thanksgiving Day. This was 21 minutes greater than the time spent eating and drinking on average for six other major holidays and 21 more minutes than on an average weekend day. Similarly, compared with the average for non-Thanksgiving holidays and weekends, people spent more time preparing meals and cleaning-up on Thanksgiving (126 minutes versus 47 minutes on non-Thanksgiving holidays and 36 minutes on weekends). When it comes to the day after Thanksgiving, people in the United States tend to spend more of their time shopping for items other than food relative to other days. Indeed, people spent 41 minutes shopping for non-food items on an average Black Friday, which is more than 240 percent higher than on an average non-Thanksgiving holiday. For more information, see USDA, Economic Research Service’s (ERS) Eating and Health Module of the American Time Use Survey in ERS’s Eating and Health Module (ATUS) data product.