

Disability status can affect food security among U.S. households
- by Laura J. Hales
- 11/14/2022
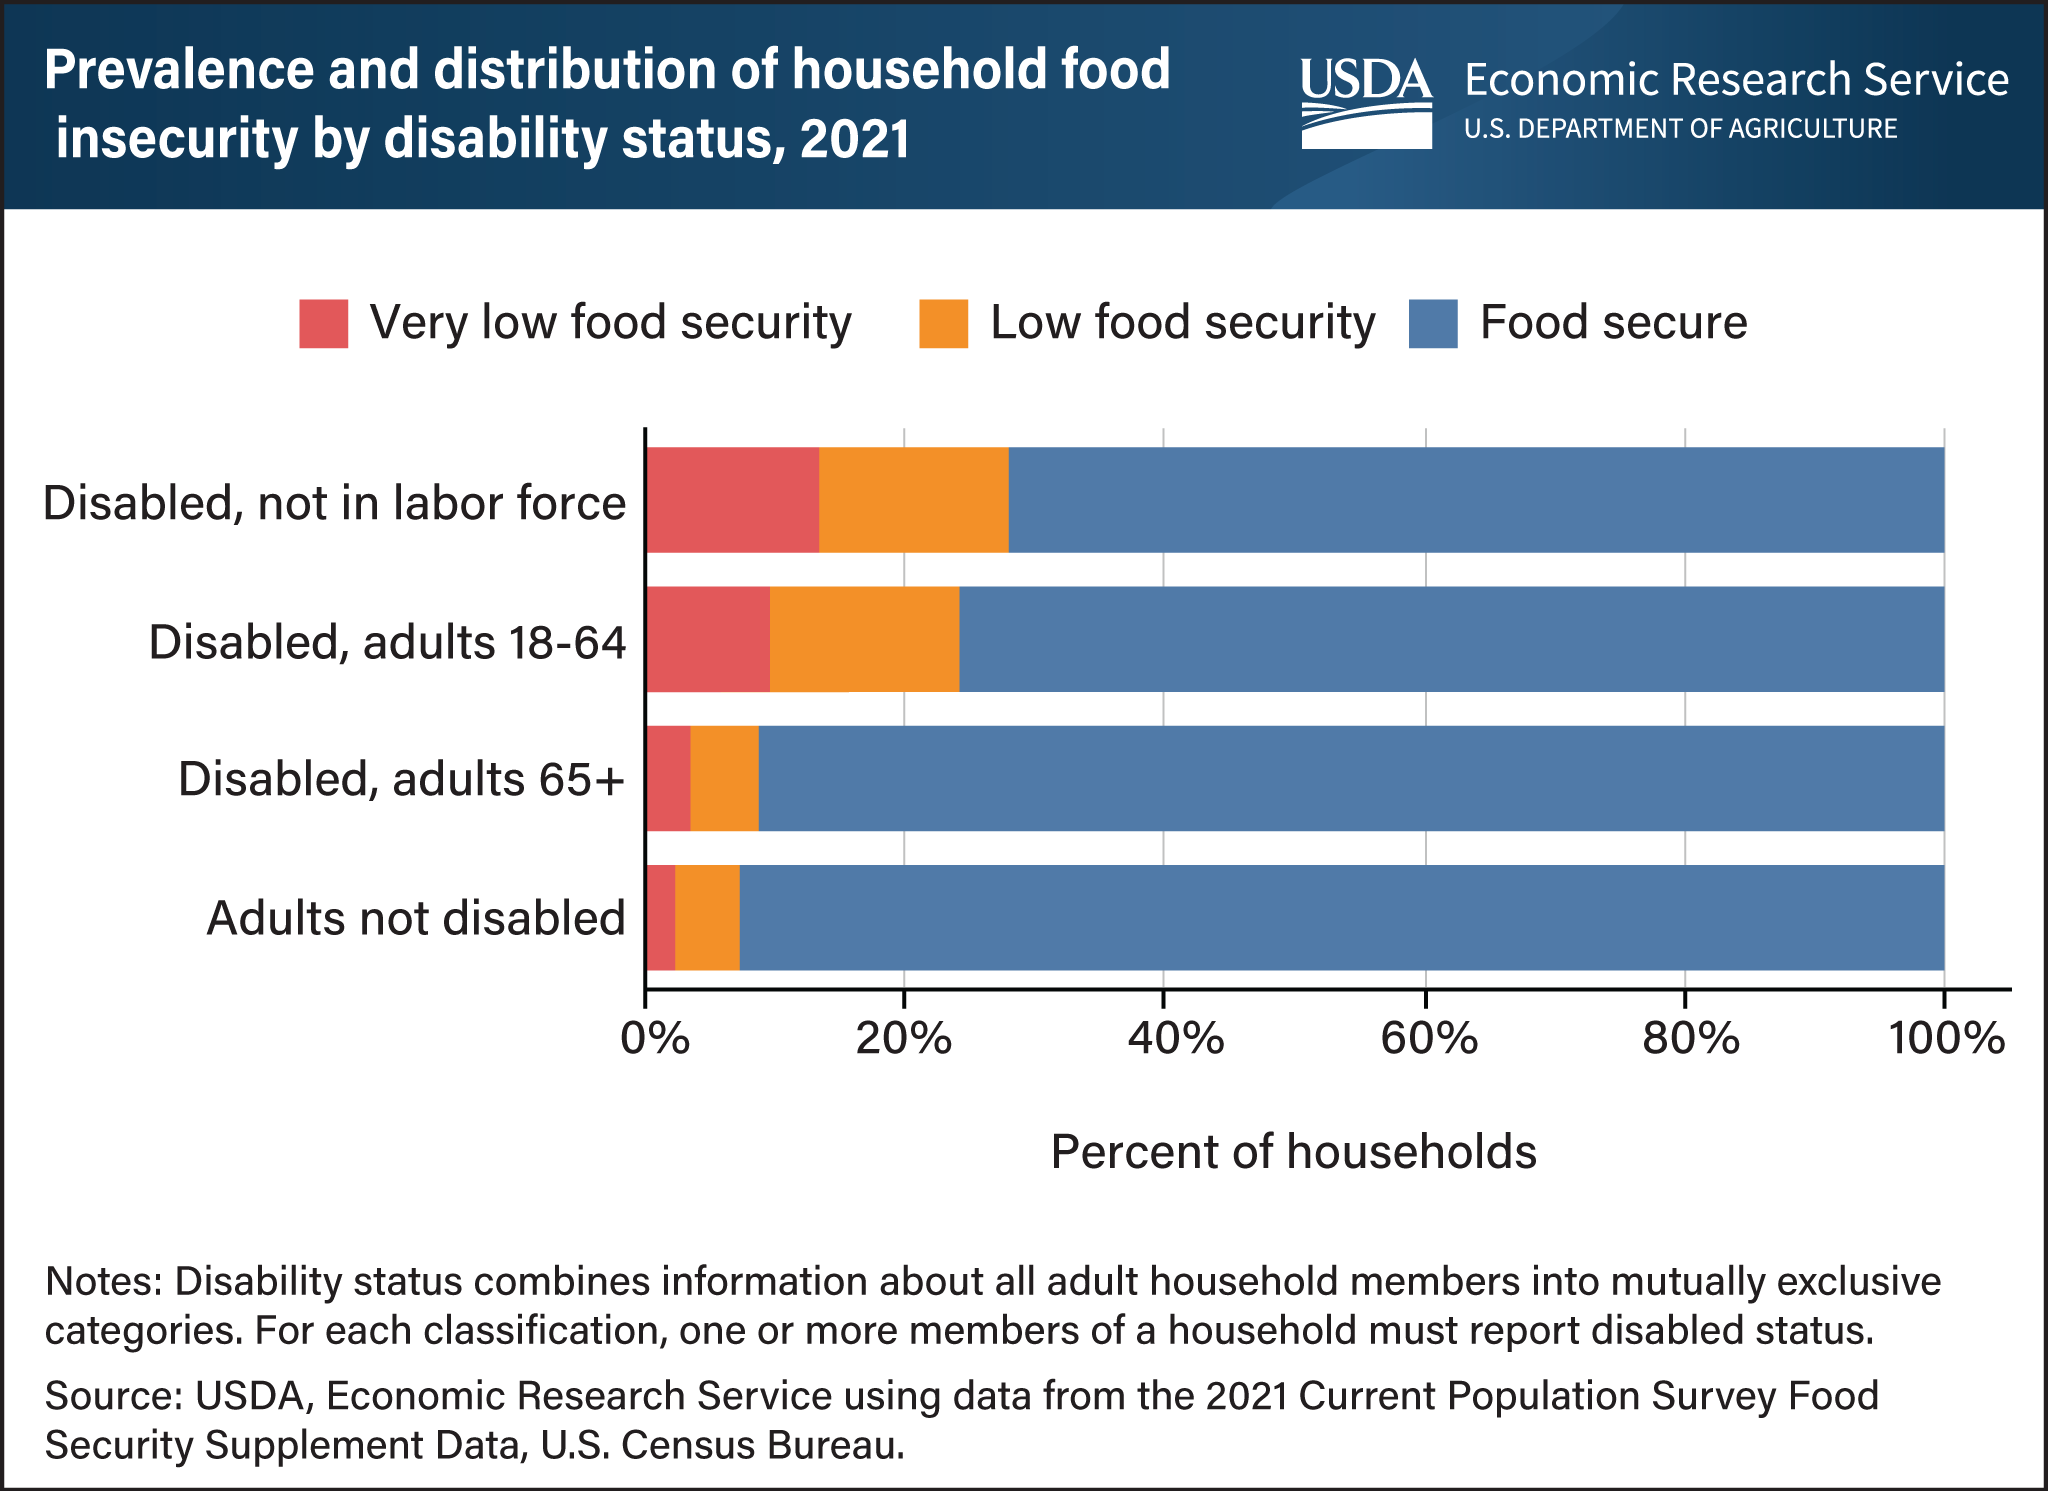
In 2021, households that included an adult with disabilities reported higher food insecurity rates than households with no adults with disabilities. Food-insecure households are those that had difficulty at some time during the year providing enough food for all their members because of a lack of resources. In 2021, for U.S. households that included an adult out of the labor force because of a disability, 28 percent were food insecure (low and very low food security). Among U.S. households with an adult age 18-64 who reported a disability but was not out of the labor force because of it, 24 percent were food insecure. In contrast, 7 percent of households with adults without disabilities were food insecure in 2021. Households that include at least one adult 65 and over who reported a disability had food insecurity prevalence rates similar to households with adults without disabilities (9 percent). Very low food security, the more severe form of food insecurity in which normal eating patterns were disrupted and the food intake of some household members was reduced, was also higher for households that included adults with disabilities. In 2021, the prevalence rate of very low food security for households that included adults not in the labor force because of a disability was more than five times that of households that included adults without disabilities (13 percent compared with 2 percent of households). Households that include adults ages 18–64 with a disability, but not out of the labor force because of the disability, also experienced higher prevalence rates of very low food insecurity at 10 percent. This chart appears in USDA, Economic Research Service’s Interactive Charts and Highlights page.