
SNAP participation varied across States from 2019 to 2021
- by Jordan W. Jones and Carmen Garson-Shumway
- 11/9/2022
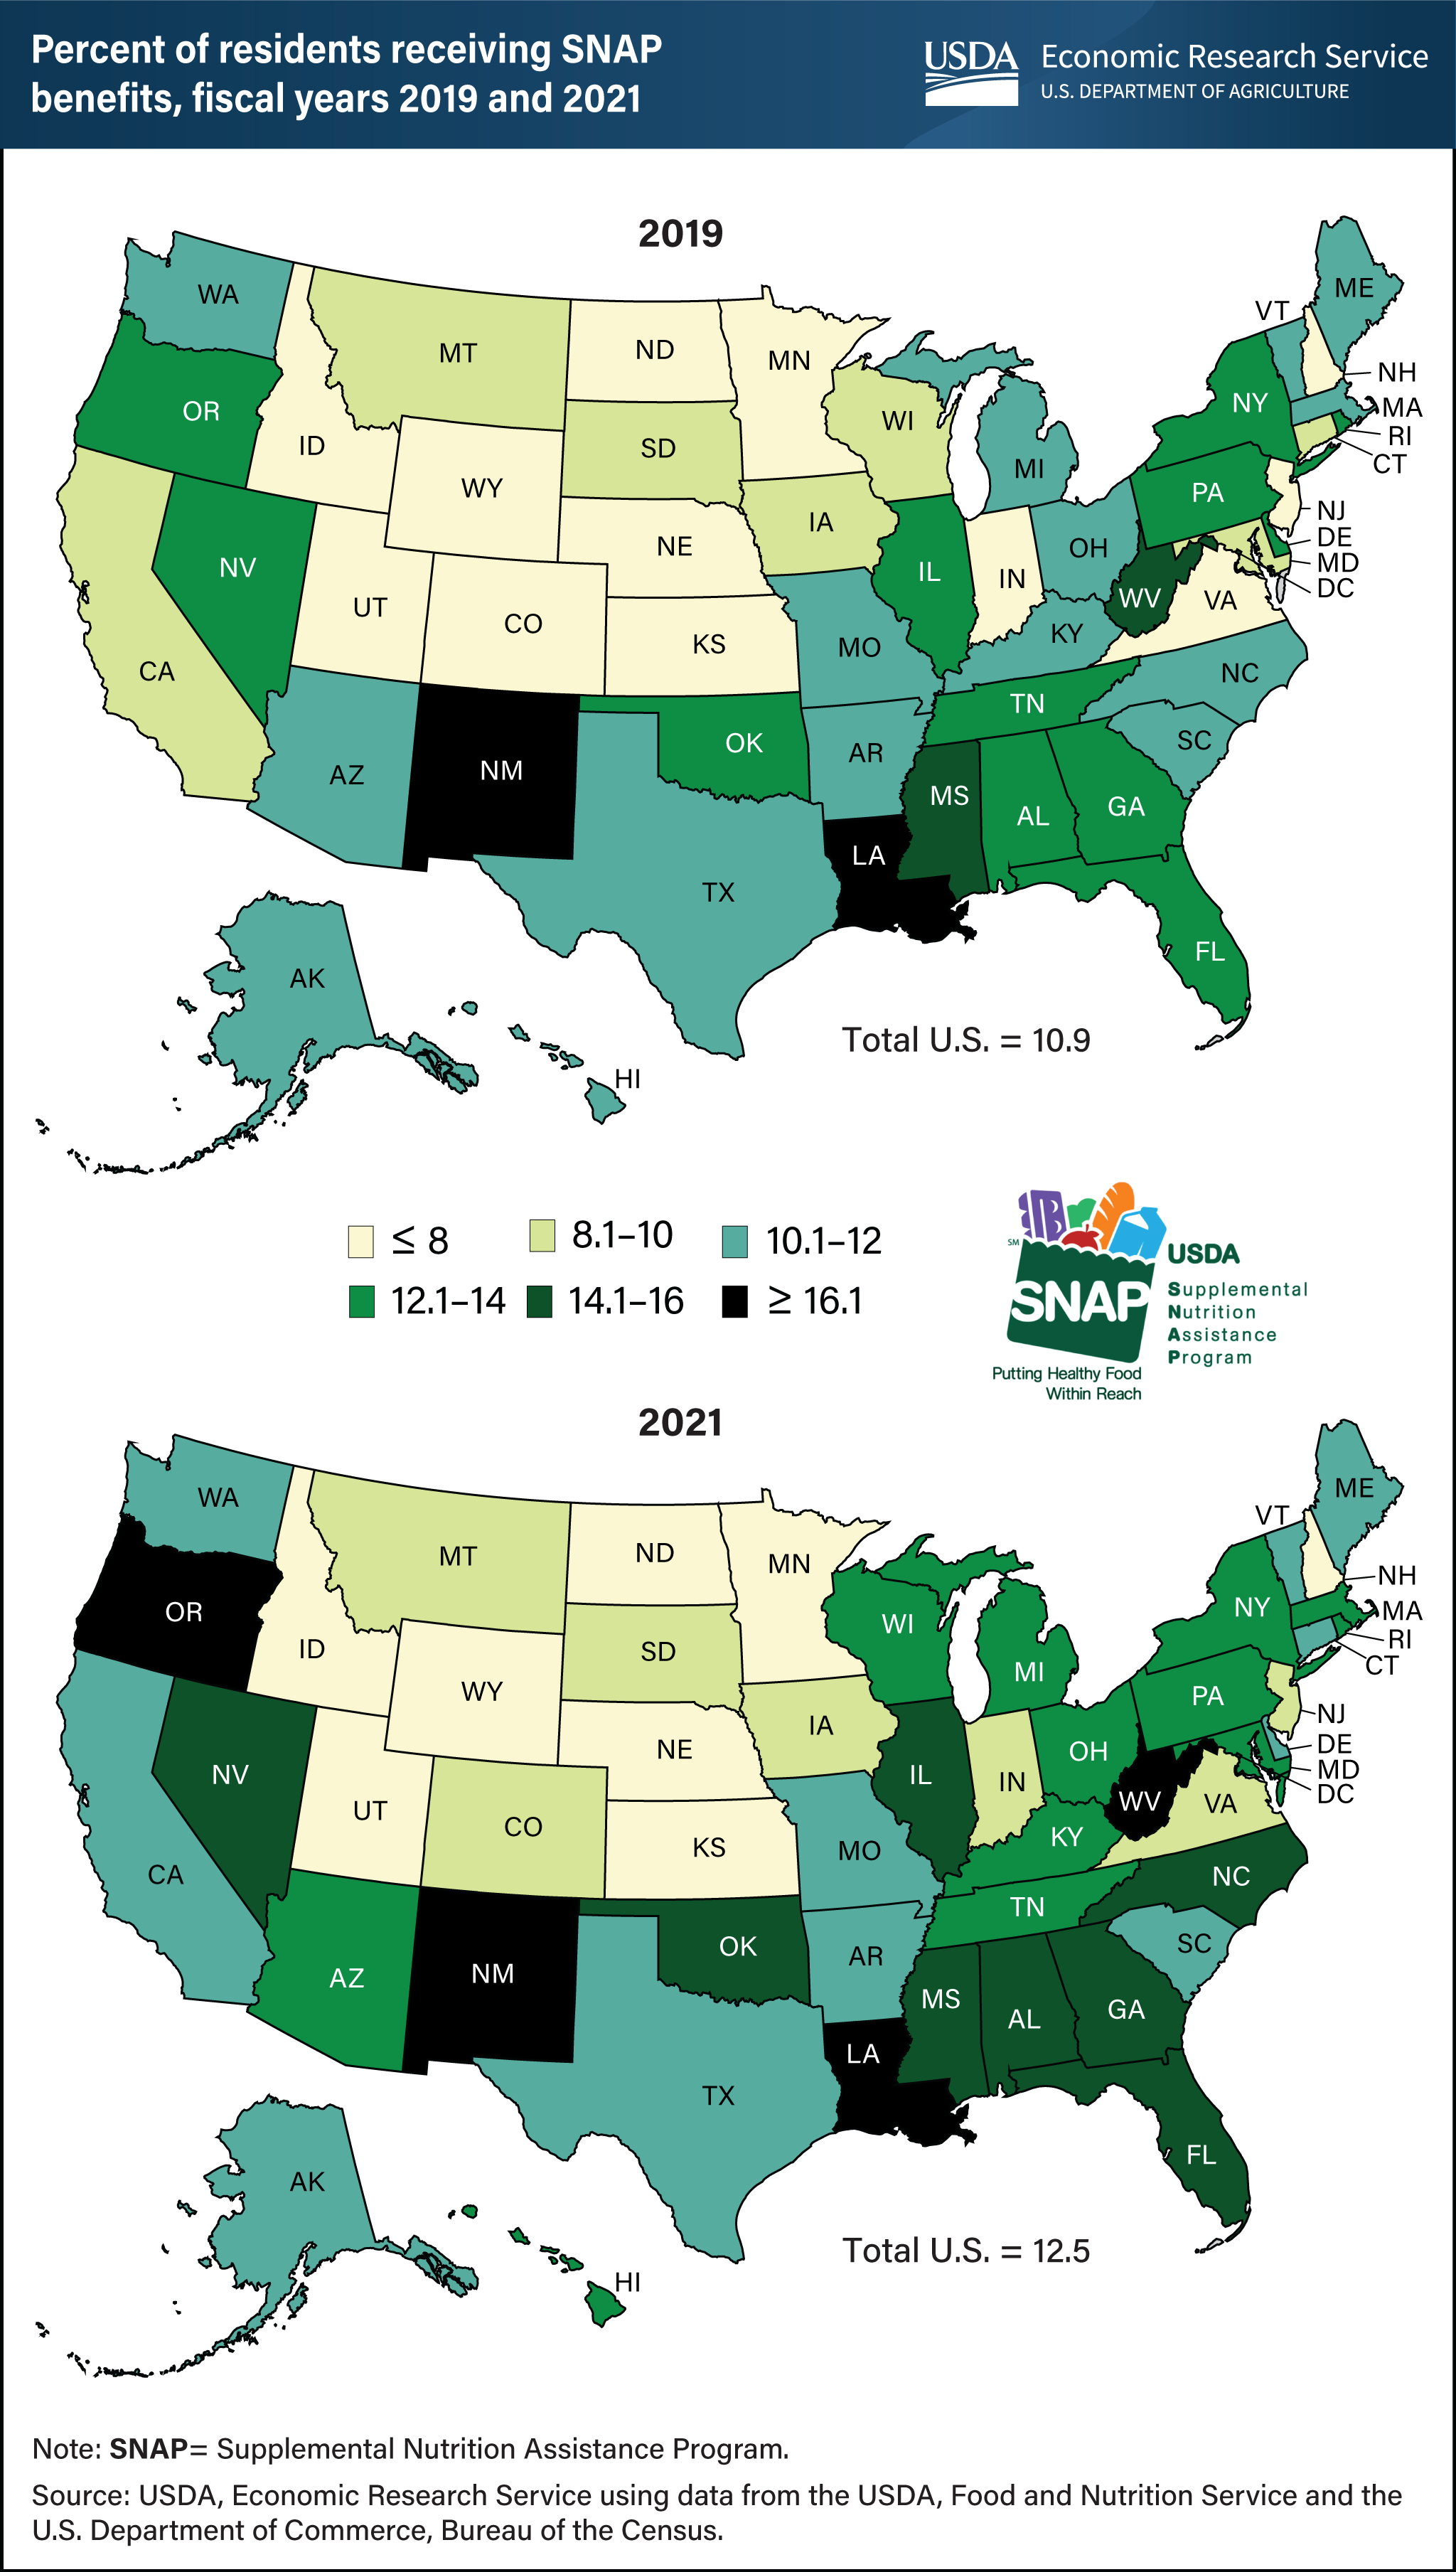
In fiscal year (FY) 2021, USDA’s Supplemental Nutrition Assistance Program (SNAP) served an average of 41.5 million people monthly, an increase of about 5.8 million per month compared with FY 2019. SNAP participation increased nationwide during the Coronavirus (COVID-19) pandemic to around 12.5 percent of the total U.S. population in FY 2021 from about 10.9 percent in FY 2019. In addition, SNAP participation data in February 2019 were artificially low because of the Federal Government shutdown (Dec. 22, 2018–Jan. 25, 2019), impacting the average participation rate. SNAP participation also varied across States because of differences in program administration and economic conditions. Over this 2-year period, 41 States saw an increase in SNAP participation, which ranged from a 0.1-percent increase in Mississippi to a 6.6-percent increase in the District of Columbia (D.C.). In D.C., the percentage of participants increased to 20.9 percent in FY 2021 from 14.3 percent in FY 2019. SNAP participation fell across 10 States in FY 2021: Arkansas, Delaware, Idaho, Iowa, Montana, New Hampshire, Rhode Island, South Dakota, Utah, and Vermont. The drops in State participation ranged from 0.1 percent in Utah to 0.8 percent in Delaware. The FY 2019 map is updated from the August 2020 Amber Waves article Taking a Closer Look at Supplemental Nutrition Assistance Program (SNAP) Participation and Expenditures and the FY 2021 map appears in Charting the Essentials, updated October 2022.
We’d welcome your feedback!
Would you be willing to answer a few quick questions about your experience?