

U.S. household food insecurity in 2021 unchanged from 2020
- by Christian A. Gregory
- 9/7/2022
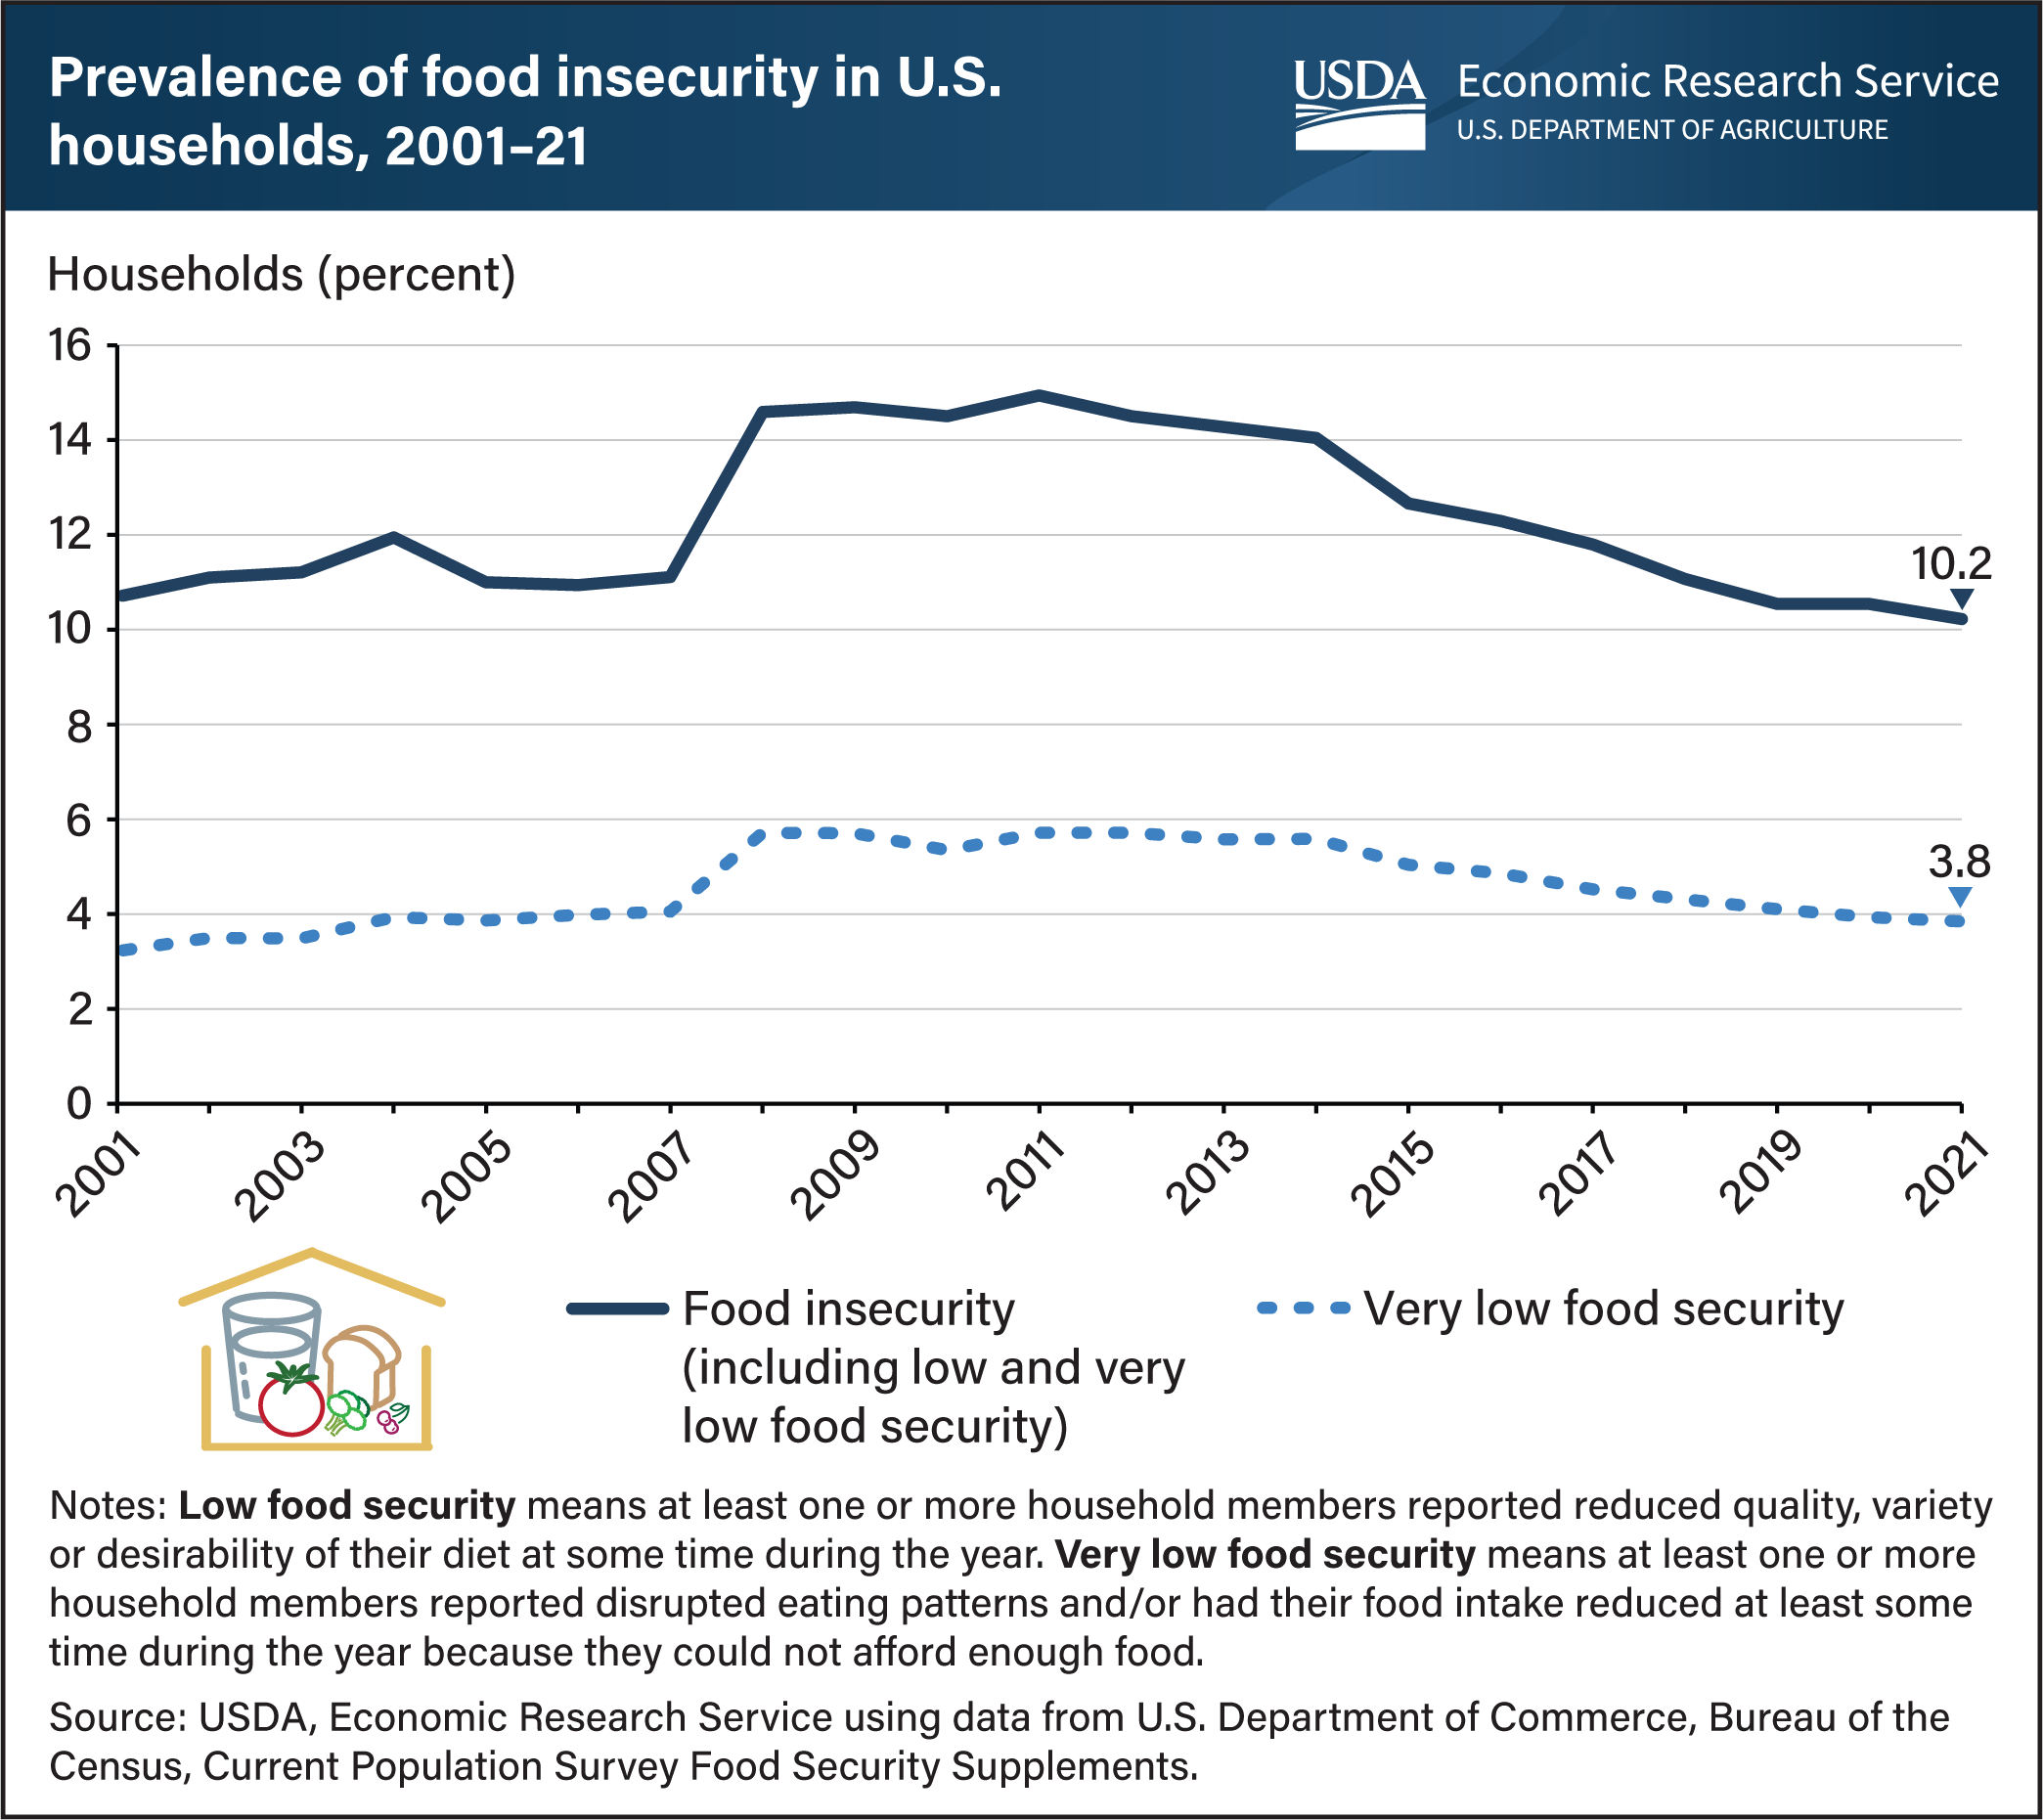
USDA’s Economic Research Service (ERS) monitors the food security status of households in the United States through an annual nationwide survey. In 2021, 89.8 percent of U.S. households were food secure throughout the entire year, meaning they had access at all times to enough food for an active, healthy life for all household members. The remaining 10.2 percent of households were food insecure at least some time during the year, including 3.8 percent that experienced very low food security. In households reporting very low food security, the food intake of one or more household members was reduced and their eating patterns were disrupted at times during the year because the household lacked money and other resources for obtaining food. The 2021 prevalence of food insecurity, at 10.2 percent, was statistically unchanged from 2020. Very low food security was not significantly different from its 3.9-percent rate in 2020. This chart appears in the ERS report, Household Food Security in the United States in 2021, released September 7, 2022.