

Labor force participation decreased less in rural areas than in urban areas at the onset of COVID-19 pandemic
- by Austin Sanders
- 5/10/2022
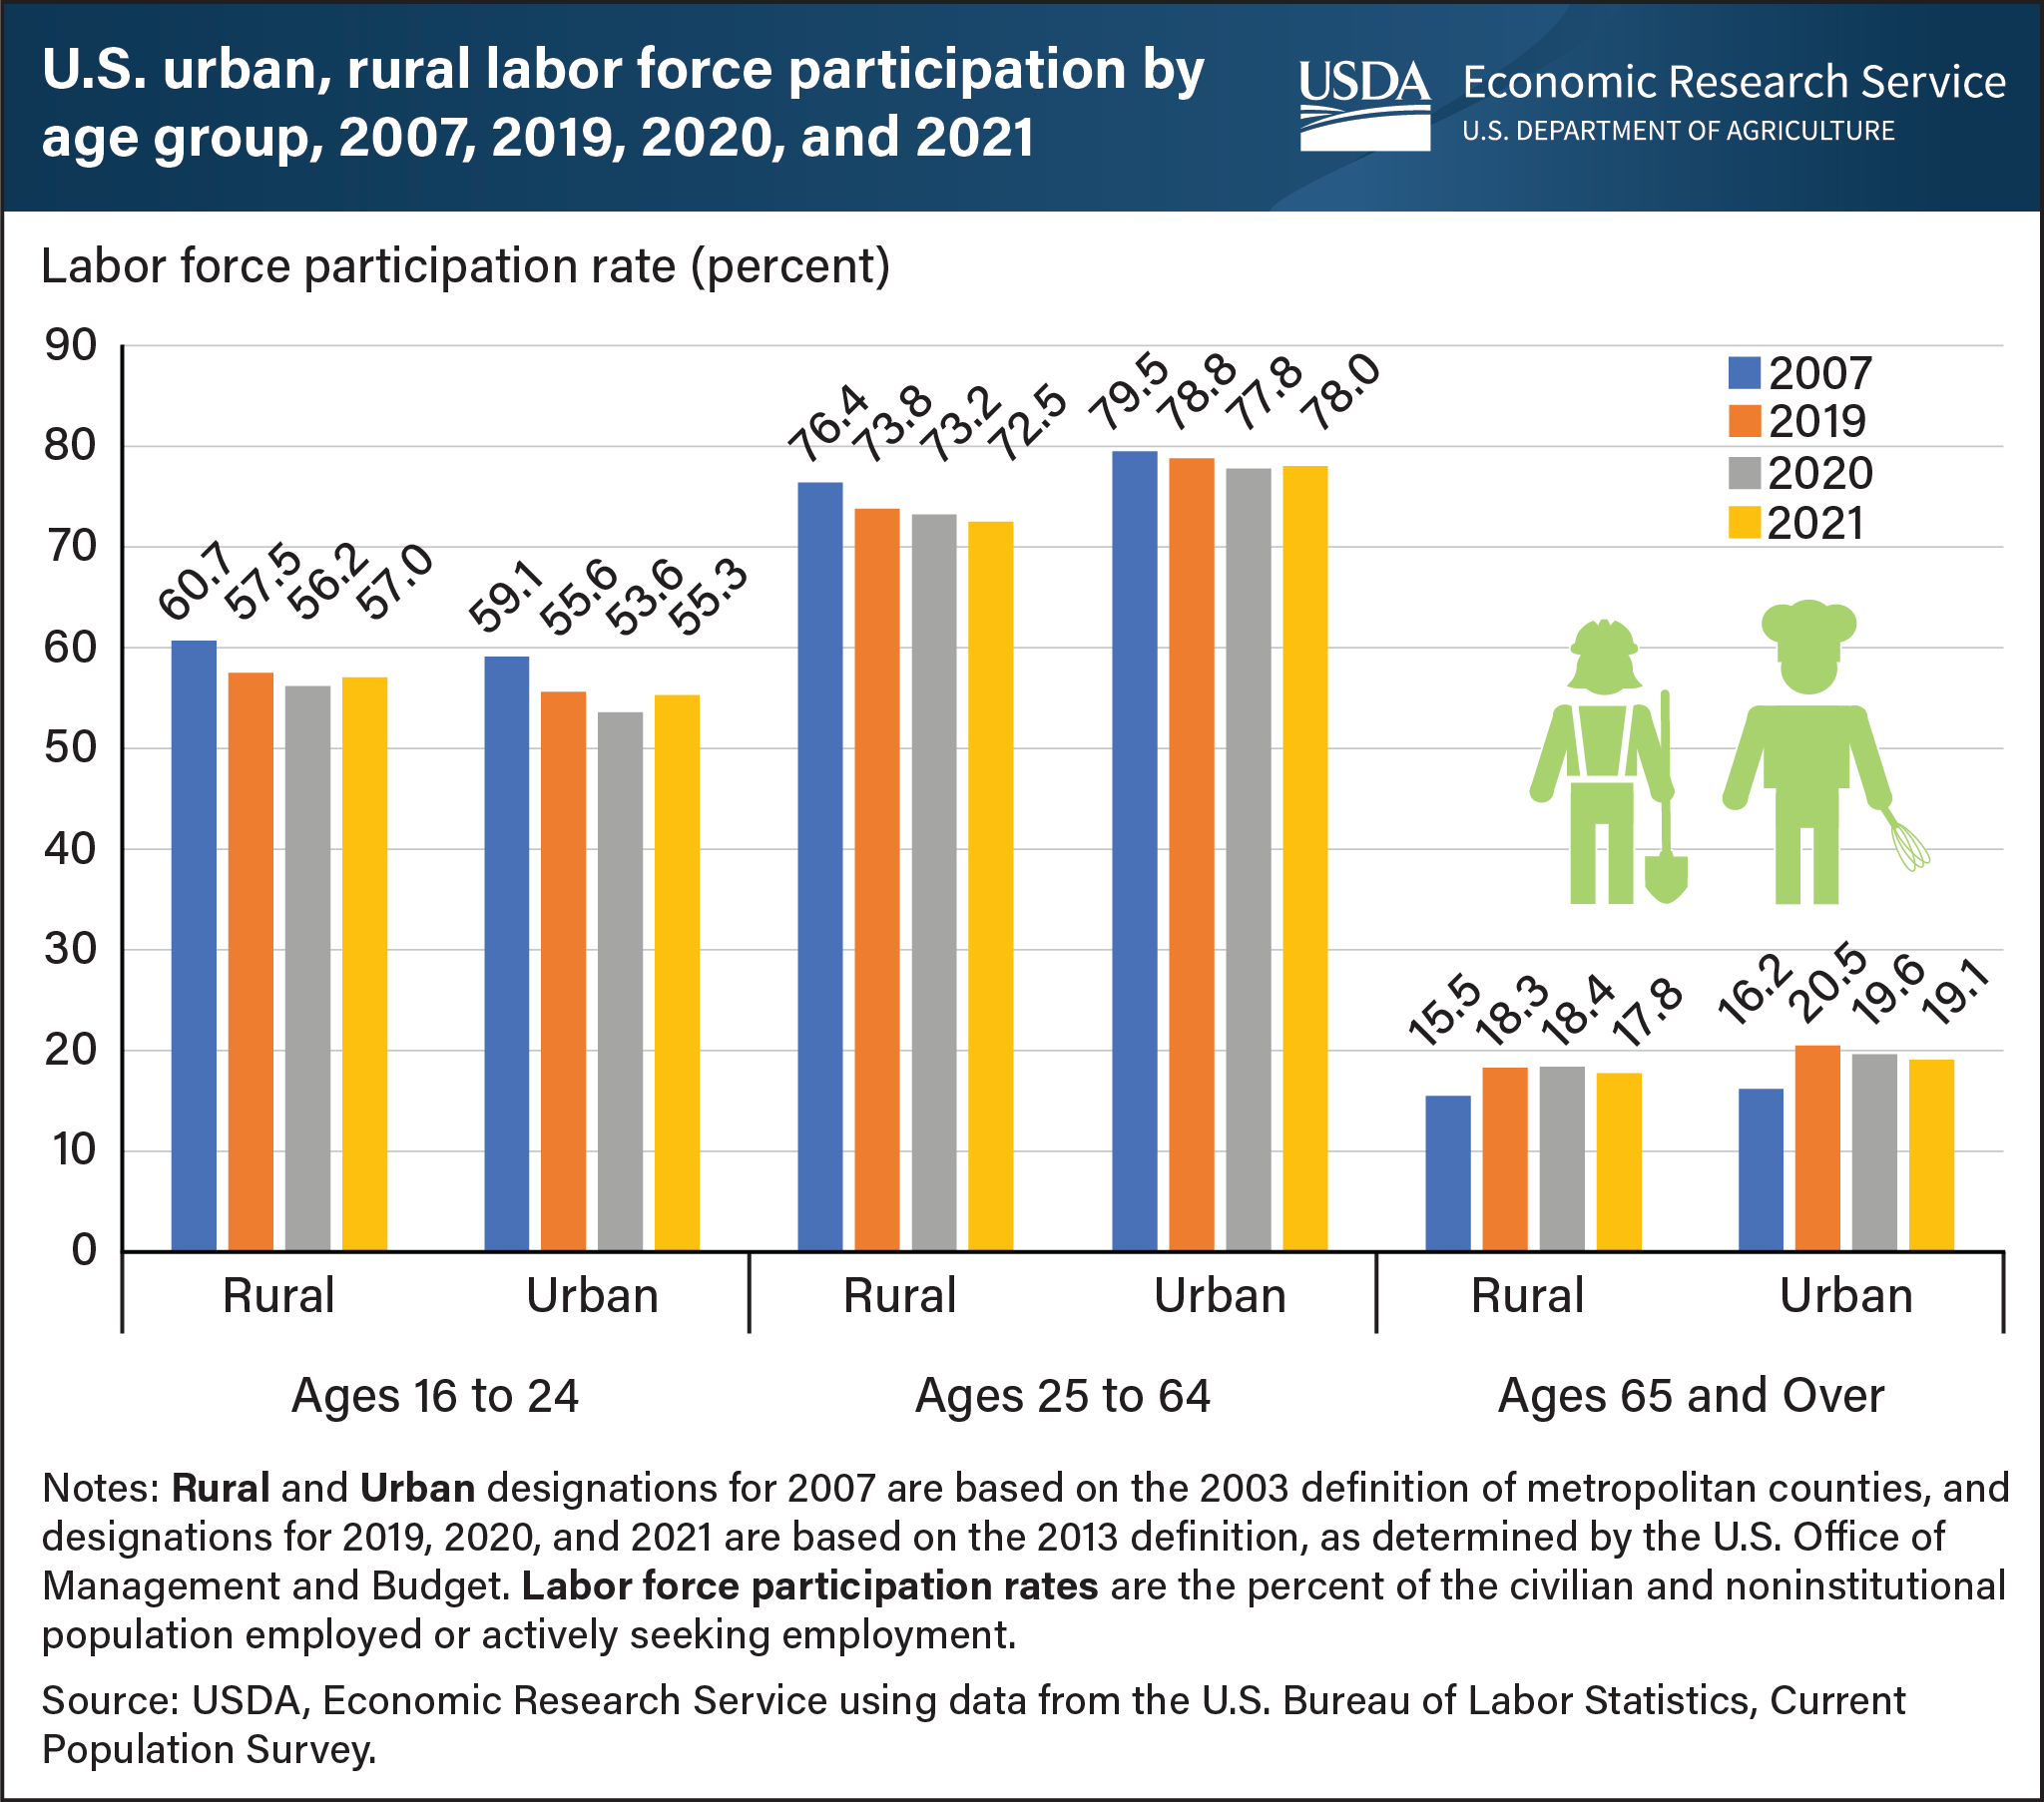
From 2007 to 2019, labor force participation rates (the percentage of the population that is working or actively looking for work) decreased 2.6 percentage points for people aged 25 to 64 in the rural United States and 0.7 percentage point for the same age group in urban areas. The larger decrease in rural participation reflects a slower recovery in those areas after the Great Recession, which lasted from December 2007 to June 2009. Labor force participation rates for people aged 25 to 64 decreased again from 2019 to 2020 due to the Coronavirus (COVID-19) pandemic but decreased less in rural counties than in urban counties (rural 0.6 percentage point vs. urban 1 percentage point). Rates declined the most from 2019 to 2020 for people aged 16 to 24 and fell the most in that age group in urban counties. In 2021, labor force participation rates for each age group remained below pre-pandemic (2019) levels in rural and urban counties and even decreased below 2020 levels for people aged 25 to 64 in rural areas and for people 65 and over in urban and rural areas. In 2021, the labor force participation rate for people aged 16 to 24 in rural counties rebounded compared with 2020. This chart was drawn from the Rural Employment and Unemployment data page, updated March 29, 2022.