
U.S. wheat prices surge in wake of Russia-Ukraine conflict
- by Andrew Sowell and Bryn Swearingen
- 4/22/2022
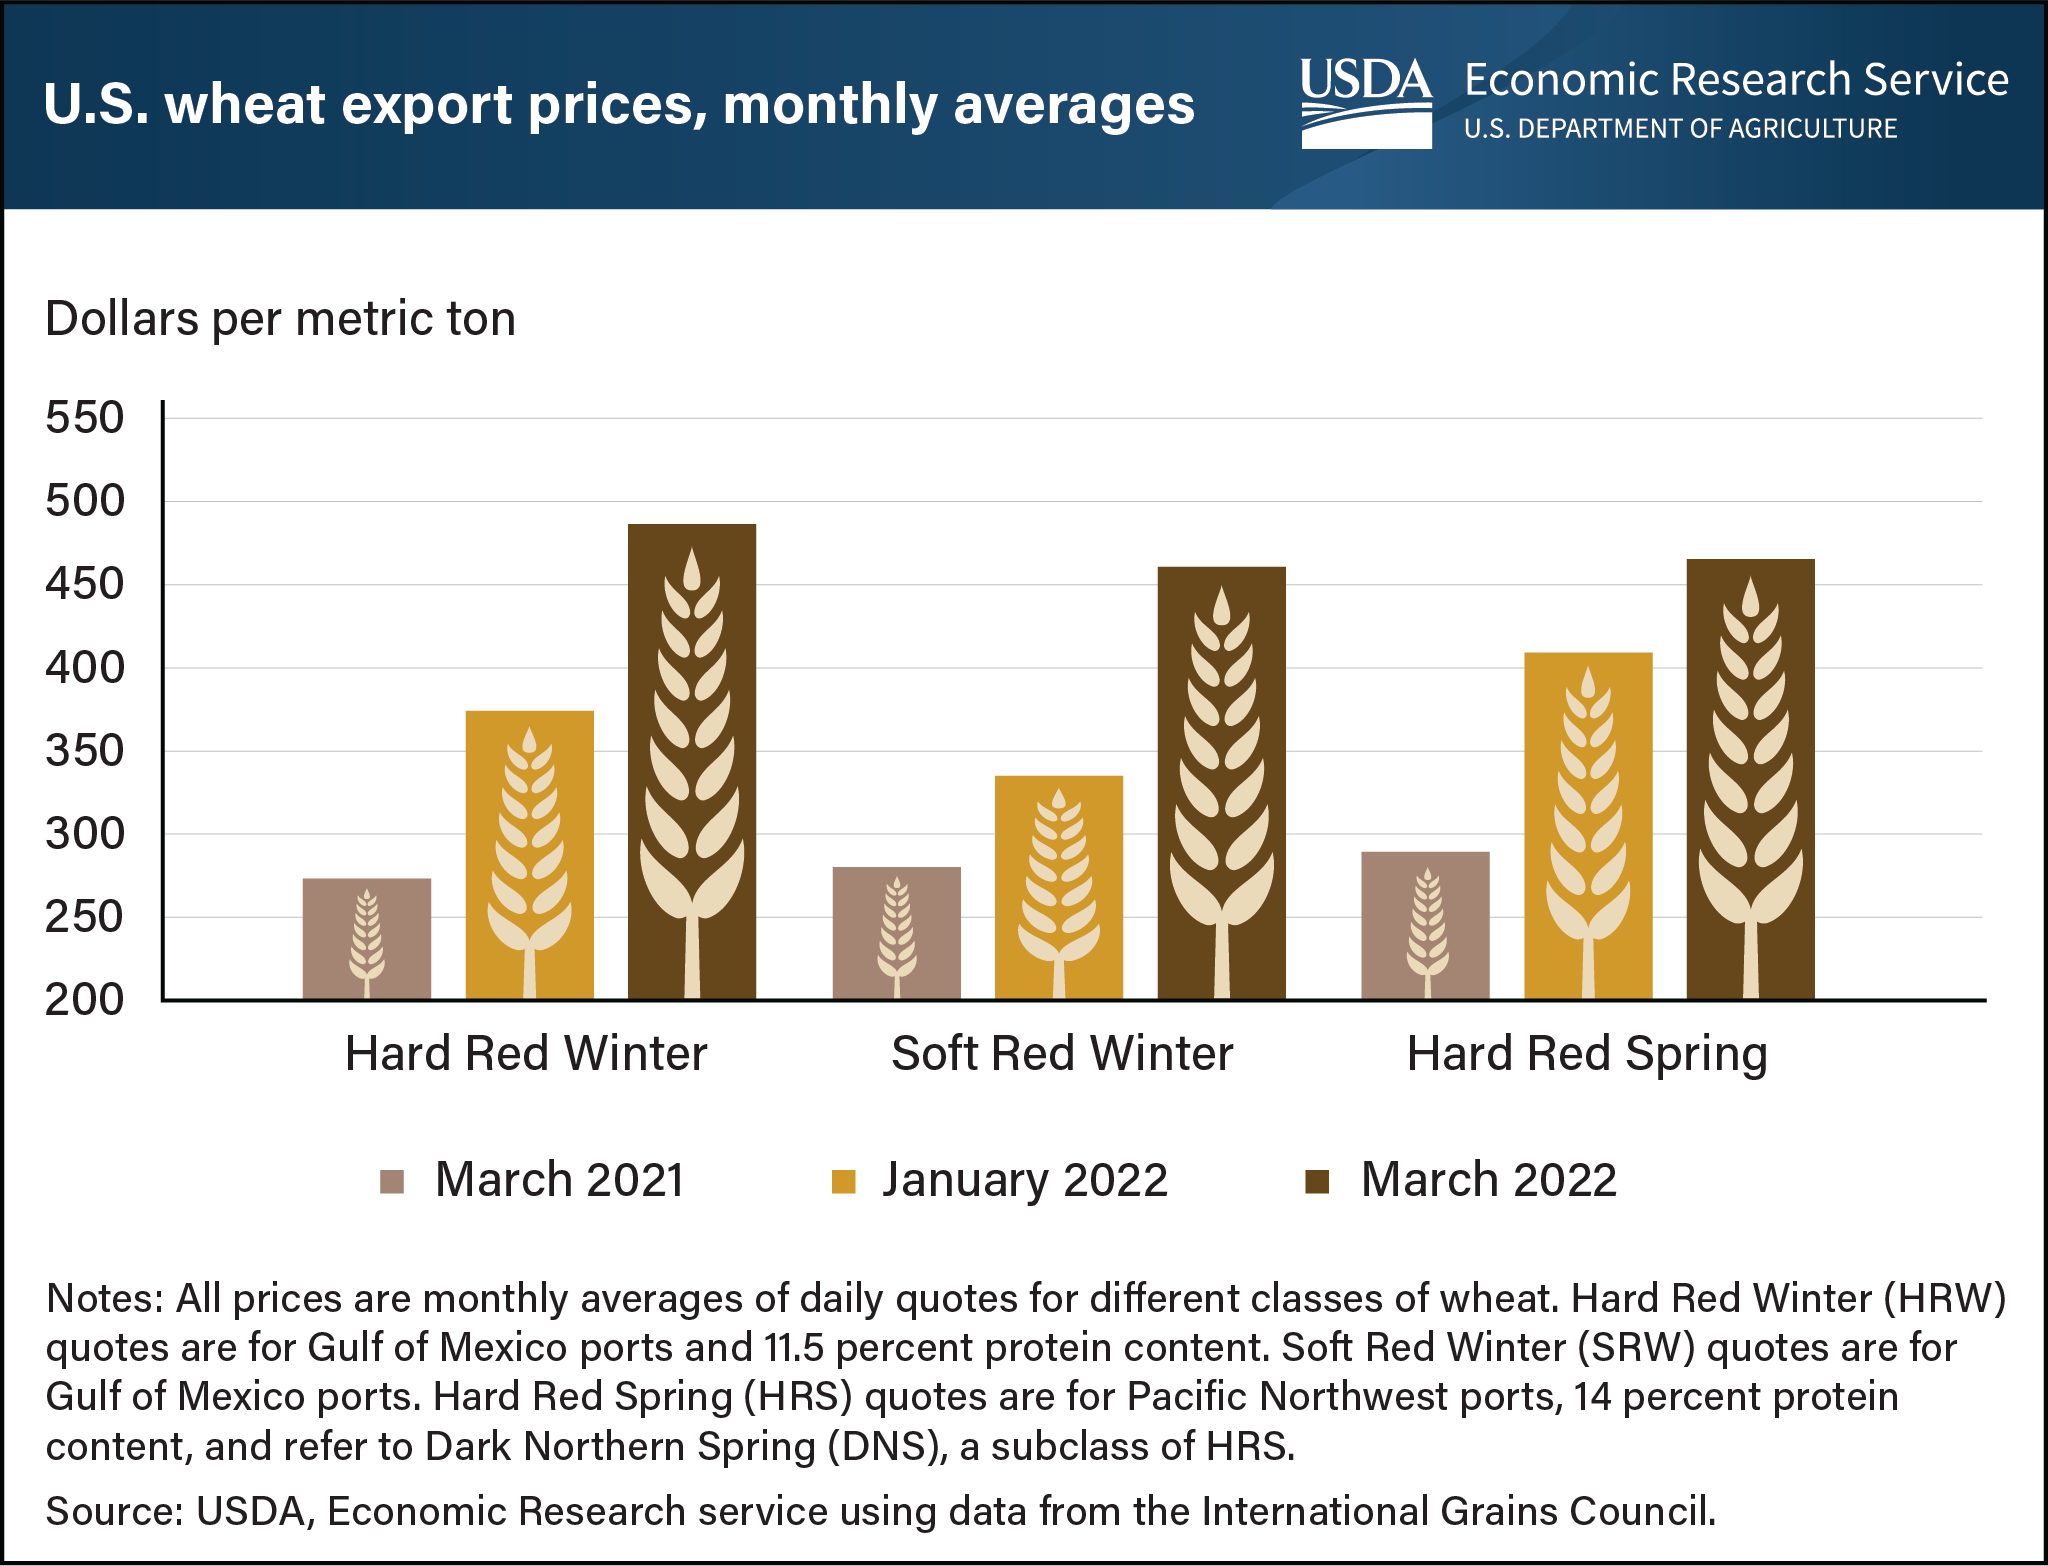
Beginning in February 2022, already elevated global wheat prices surged in the wake of the conflict between Russia and Ukraine, who together accounted for 28 percent of all wheat exports in marketing year 2020/21. Throughout the current marketing year (2021/22), tight supplies have been forecast for key exporting countries including Argentina, Australia, Canada, the European Union, Kazakhstan, Russia, Ukraine, and the United States. Collectively for these countries, ending stocks are projected at the lowest level since the 2013/14 marketing year. For most of the current marketing year, tight supplies have supported relatively high global wheat prices. Those prices have been driven higher as commodity markets reflect uncertainty about not only the ability of Russia and Ukraine to continue exporting in coming months, but also the implications of the conflict on Ukraine’s spring planting which typically begins in March. Since the conflict began, U.S. export prices have risen for Hard Red Winter (HRW) and Soft Red Winter (SRW)—the two wheat classes that most directly compete with Russian and Ukrainian wheat. Average export prices for HRW were up 78 percent in March from the same month in 2021, and SRW prices were up 64 percent. U.S. Hard Red Spring (HRS), typically the highest priced U.S. wheat, is currently priced lower than HRW and only slightly above SRW. Domestic transportation challenges and dry conditions in major HRW production areas have also underpinned U.S. prices and allowed major competitors to maintain a large pricing advantage. Most HRS exports are shipped out of the Pacific Northwest and are largely destined for Asian markets. Because HRS exports do not compete directly with Russia and Ukraine, the price reaction of this wheat class has been less extreme when compared with the more dramatic price reactions of the other classes. This chart first appeared in USDA, Economic Research Service’s Wheat Outlook, March 2022, and has been updated with recent data from the Wheat Outlook, April 2022.