

Food prices were below overall inflation in 2021
- by Matthew MacLachlan
- 2/23/2022
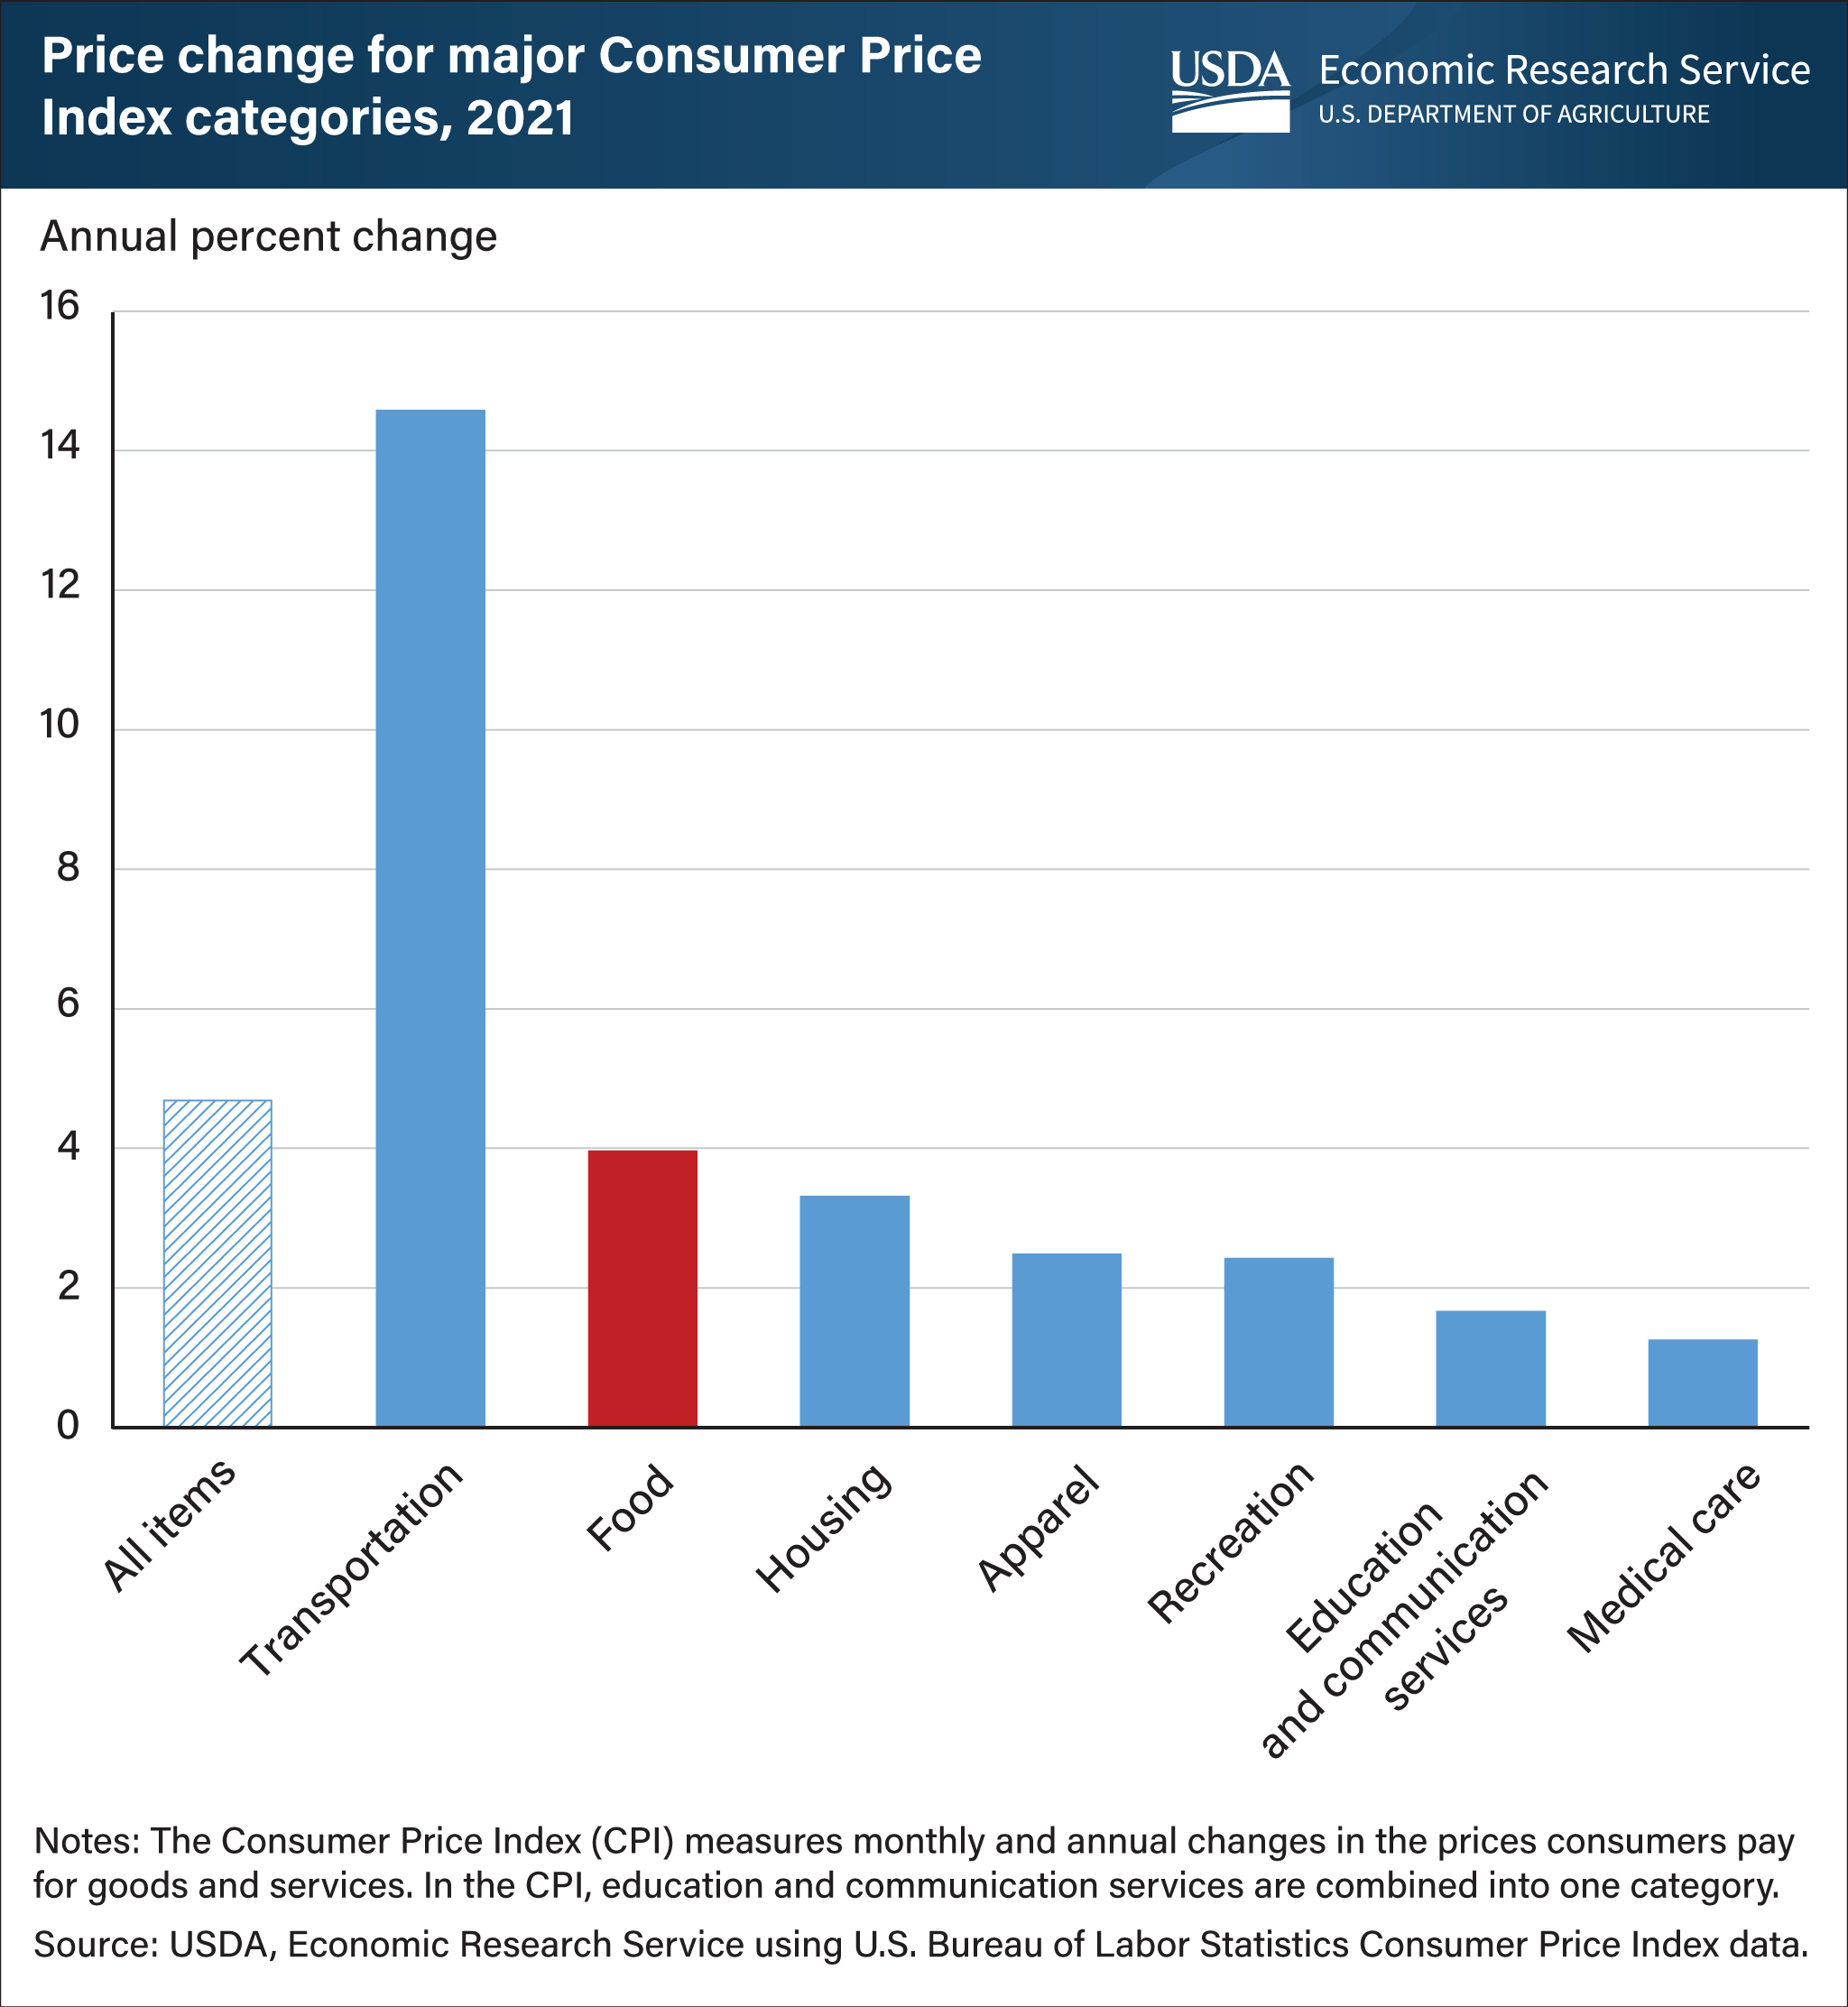
Food prices overall increased by an average of 3.9 percent in 2021 compared to 2020, the highest annual increase since 2008. Food prices grew more slowly than the “all items” and transportation CPIs, but more quickly than all other of the “major groups” tracked by the U.S. Bureau of Labor Statistics (BLS). The CPI for all items rose 4.7 percent in 2021. Among the food categories that comprise the food CPI, the food-away-from-home (restaurant purchases) CPI increased 4.5 percent, compared with an increase of 3.5 percent for food-at-home (grocery stores or other purchases from food retailers). The highest price increases in food-at-home categories in 2021 were for beef and veal (9.3 percent), pork (8.6 percent), and fresh fruit (5.5 percent). Using the CPI data, USDA, Economic Research Service (ERS) researchers project overall food prices will increase between 2 and 3 percent in 2022. A five-year comparison of changes in major CPI categories is available in the Food Prices and Spending section of ERS’s Ag and Food Statistics: Charting the Essentials data product, and a time-series visualization of the data appears in the Food Price Environment data tool. More information on ERS’s monthly food price forecasts can be found in ERS’s Food Price Outlook (FPO) data product. The next FPO release is February 25, 2022.