

Food insecurity rates vary across States
- by Laura J. Hales
- 2/28/2022
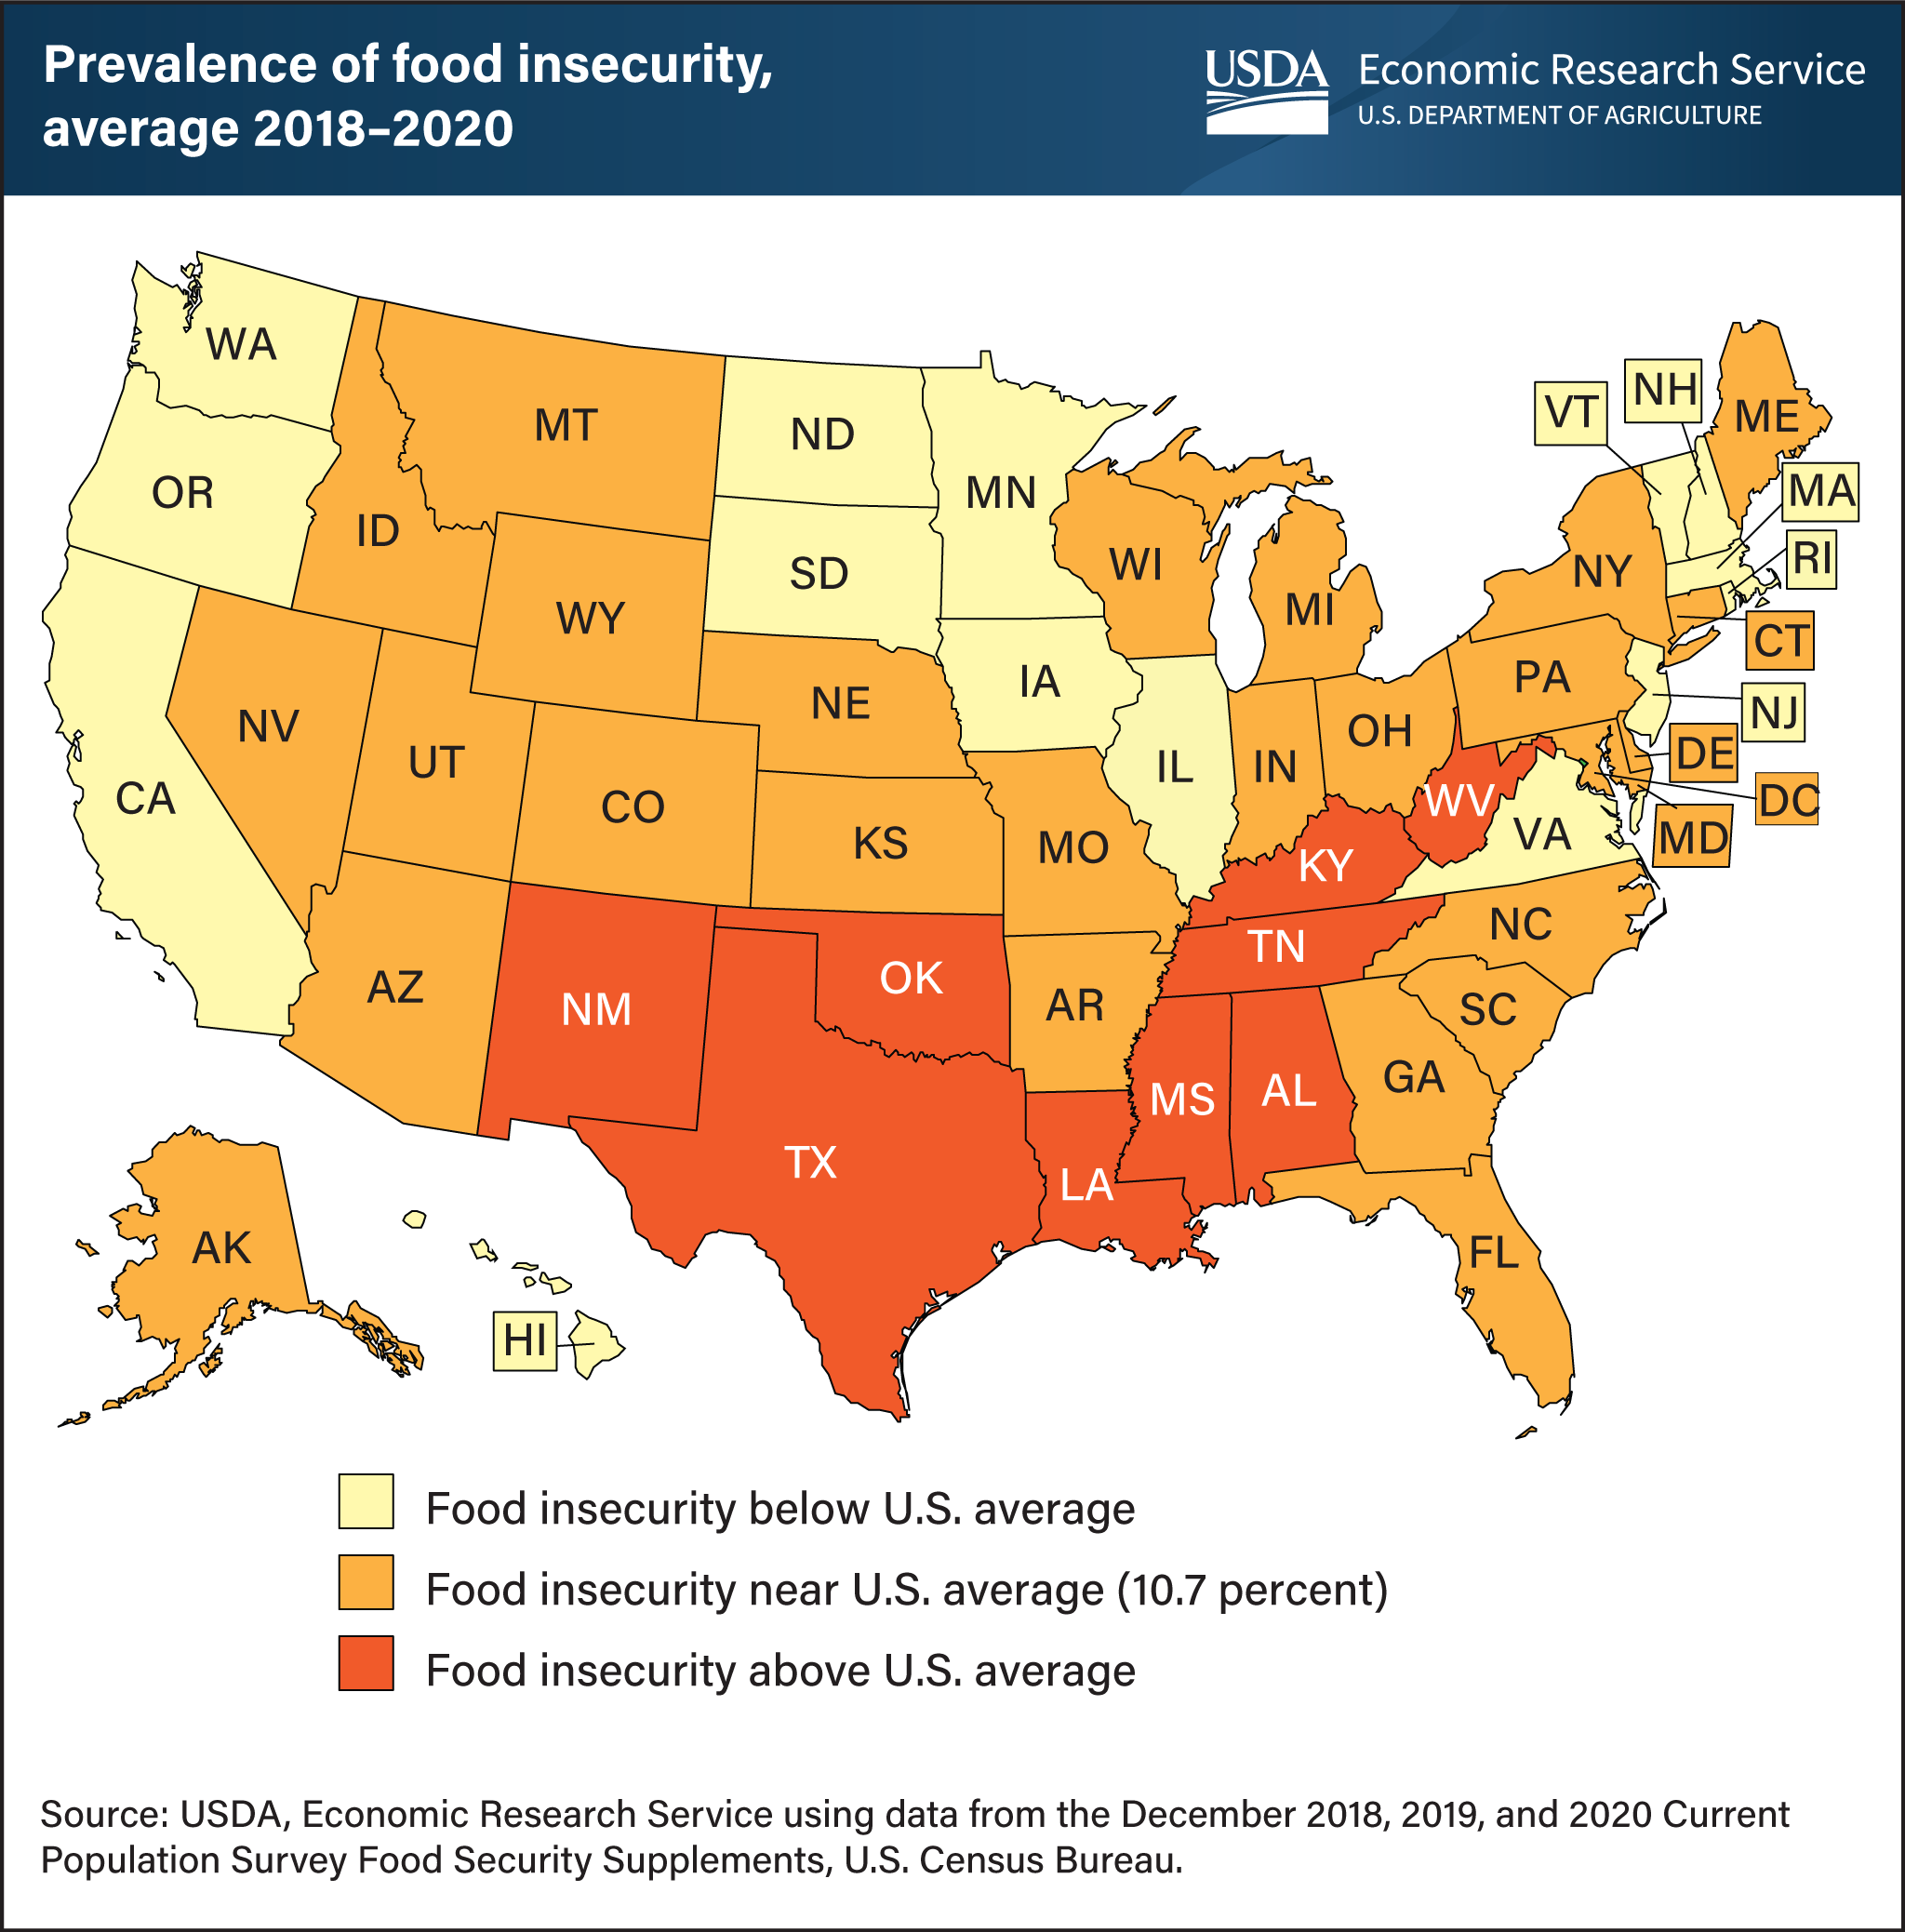
Food-insecure households are defined as those that had difficulty at some time during the year providing enough food for all their members because of a lack of resources. USDA monitors the extent of food insecurity in U.S. households at the national and State levels through an annual U.S. Census Bureau survey. State-level estimates are then obtained by averaging 3 years of data to generate more reliable statistics. State food insecurity rates vary because of State-level characteristics such as population, policies, and economic conditions. The estimated prevalence of food insecurity during 2018–20 ranged from 5.7 percent in New Hampshire to 15.3 percent in Mississippi. The estimated national average was 10.7 percent. The prevalence of food insecurity was significantly higher than the national average in 9 States (AL, KY, LA, MS, NM, OK, TN, TX, and WV) and lower than the national average in 15 States (CA, HI, IA, IL, MA, MN, ND, NH, NJ, OR, RI, SD, VA, VT, and WA). In the remaining 26 States and the District of Columbia, differences from the national average were not statistically significant. This map appears in the Food Security and Nutrition Assistance section of the Economic Research Service’s Ag and Food Statistics: Charting the Essentials.