Inspection of year-over-year changes in slaughter rates reveals variation across States

A map of the United States showing the percent change in hog slaughter from 2019 to 2020, broken down by color indicating which states had -70 to -30 percent change, -30 to 0 percent change, 0 to 30 percent change and >30 percent change.

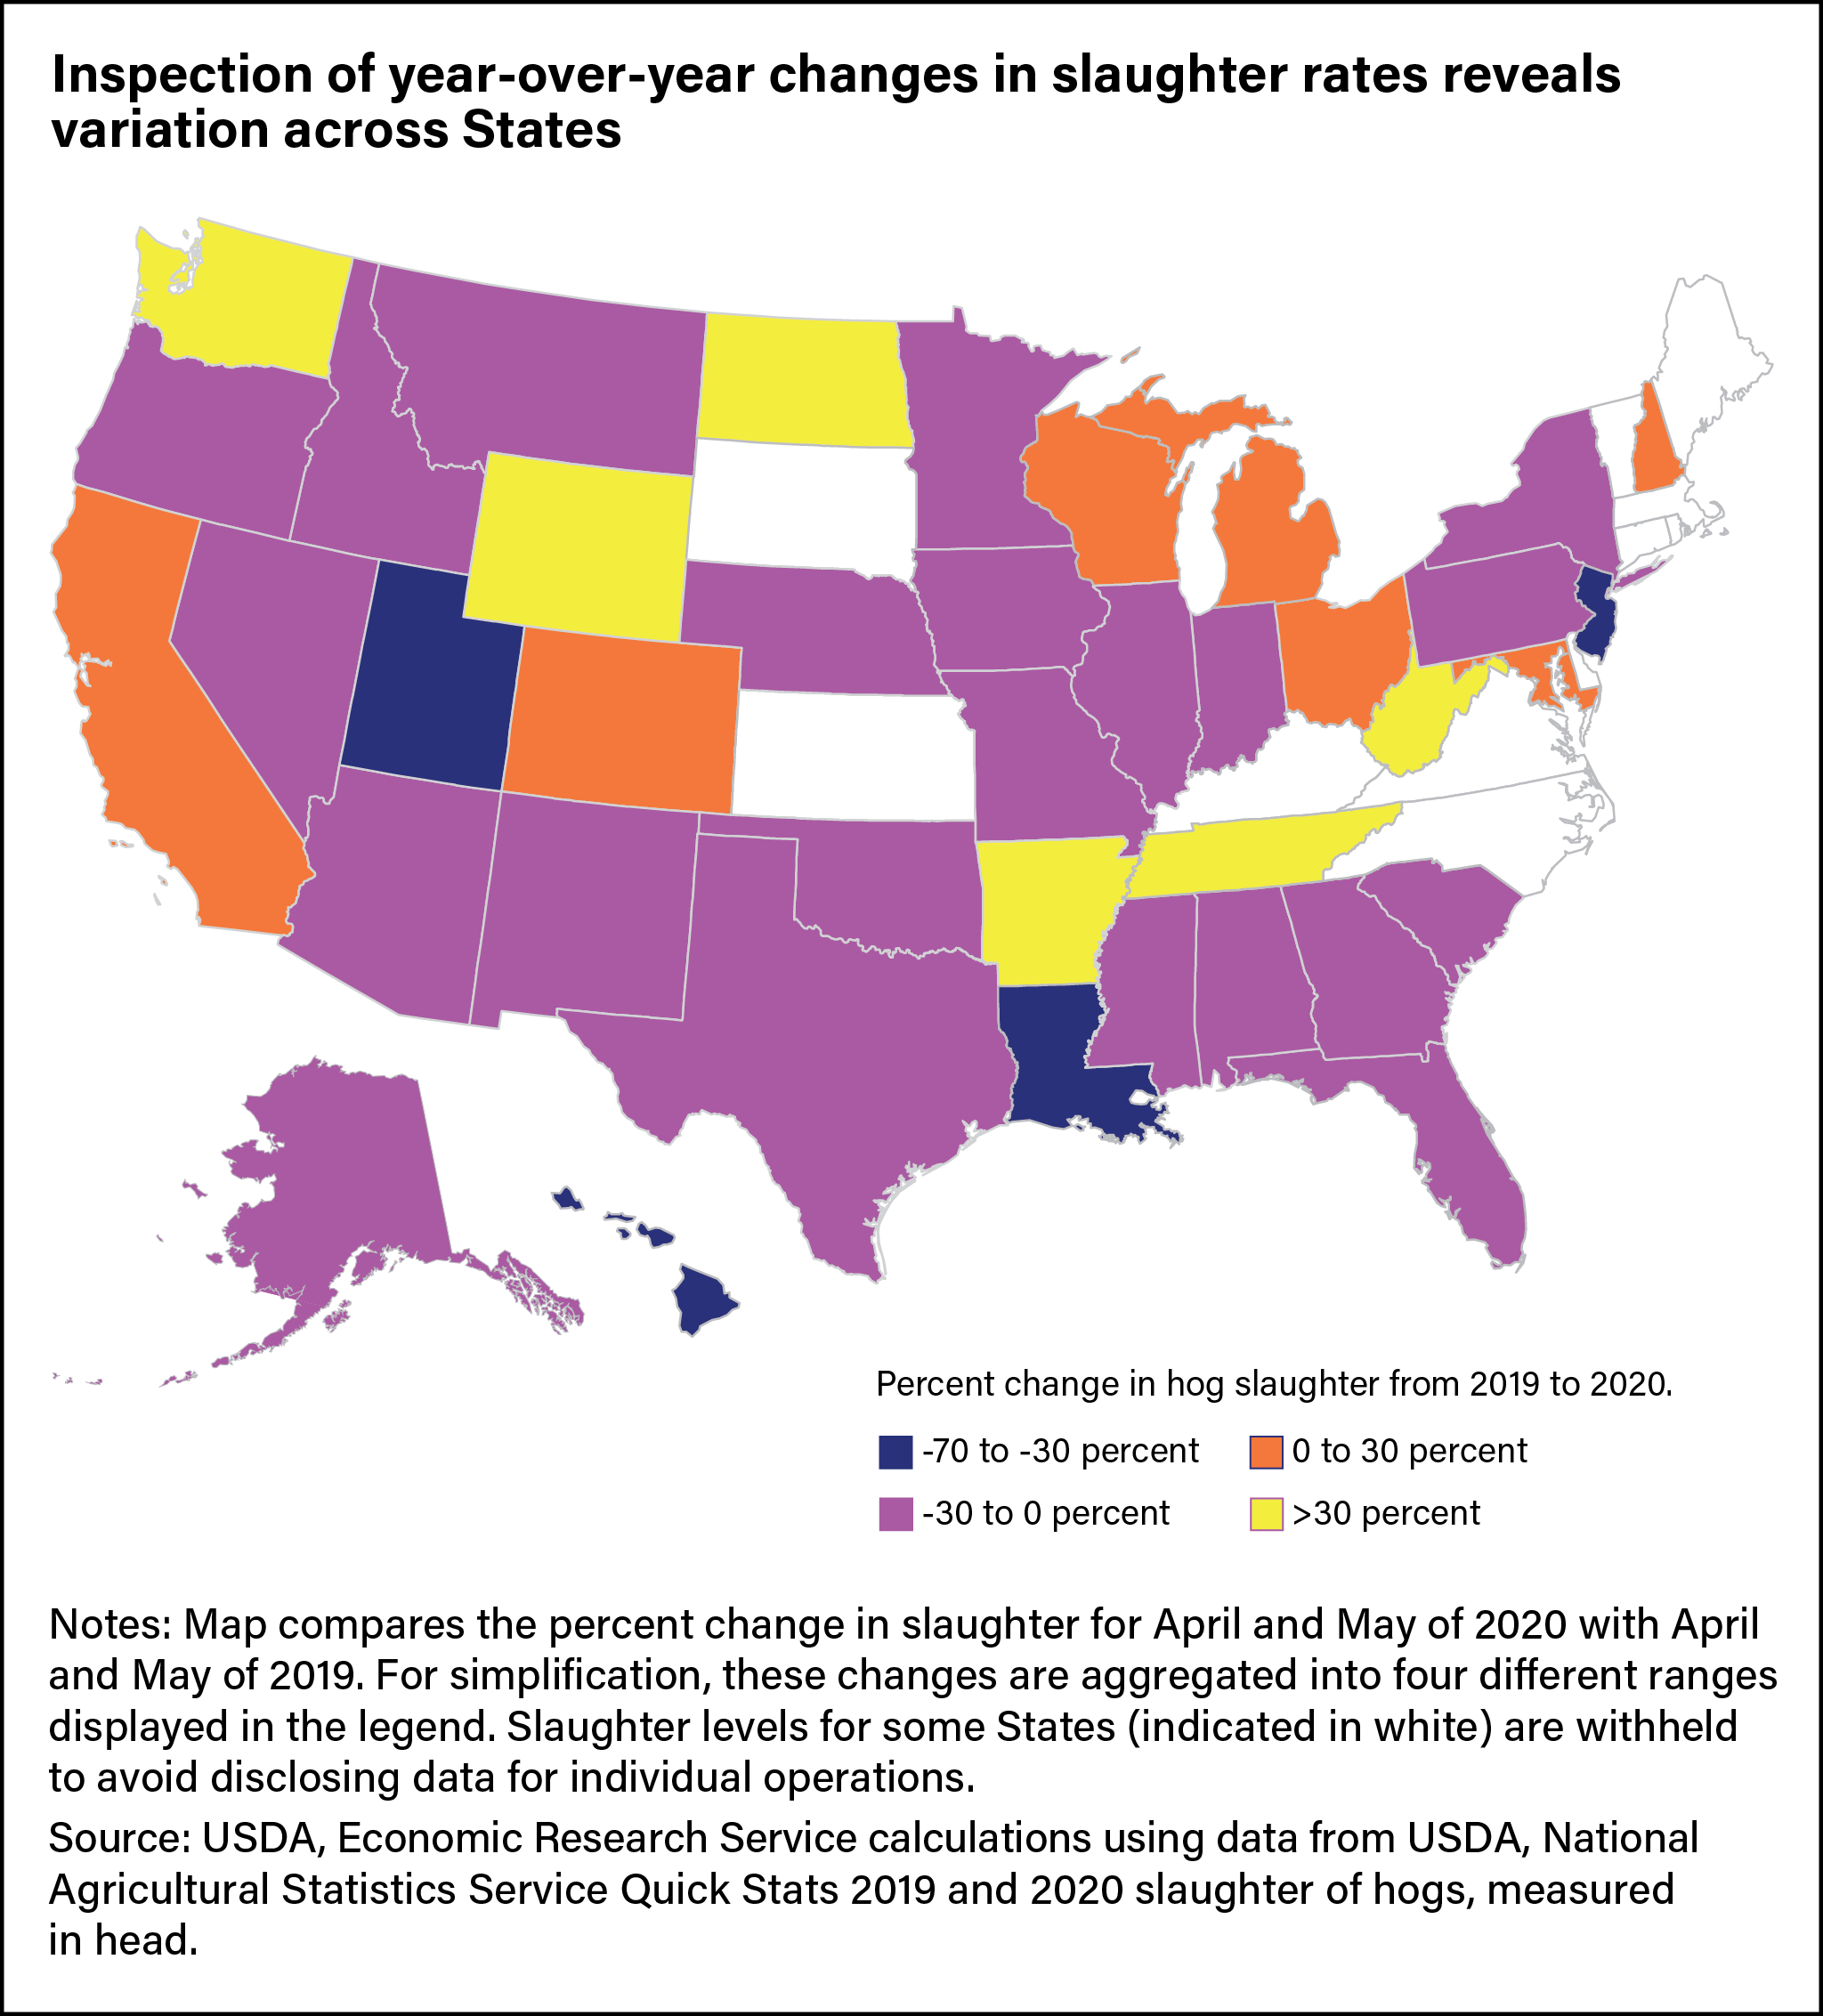
The Coronavirus (COVID-19) pandemic sparked a sharp decline in U.S. hog slaughter rates but each region recovered differently.


Download larger size chart (2048 pixels by 2265, 144 dpi)