
Increased efficiency has replaced input intensification as primary source of growth in global agricultural output
- by Keith Fuglie
- 1/12/2022
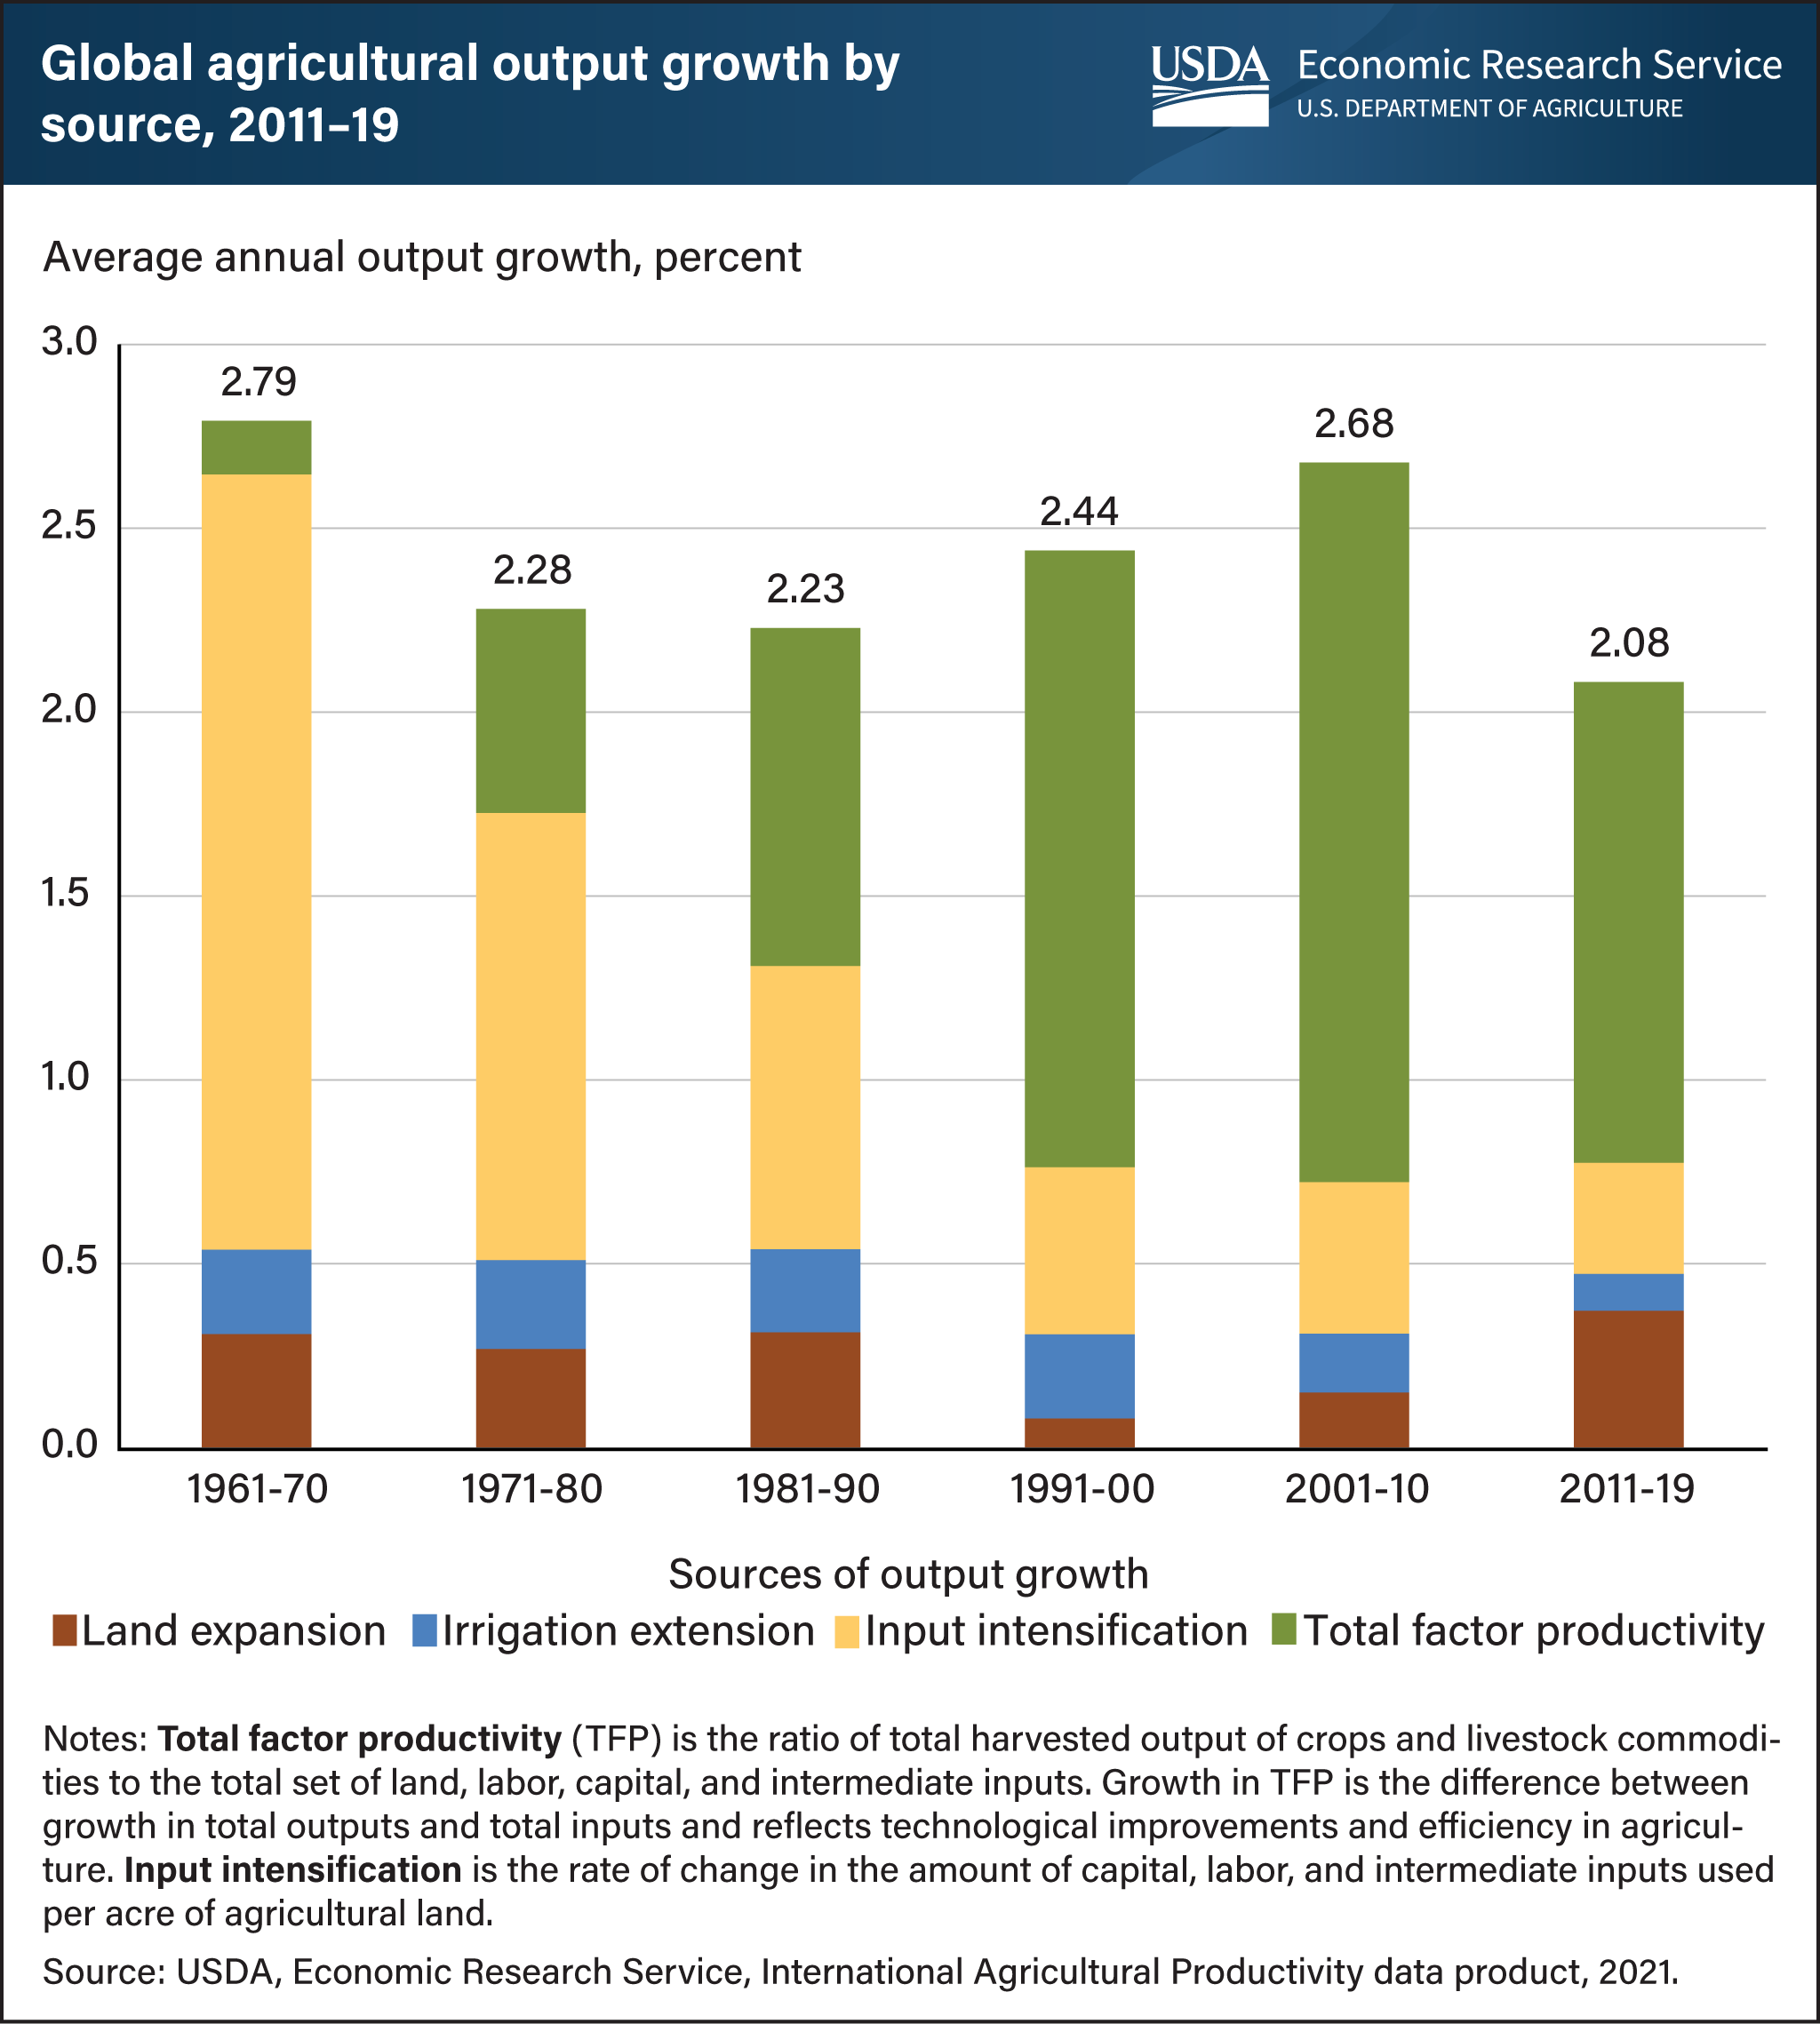
Since the 1960s, global agricultural output by volume has increased at an average annual rate of 2.3 percent, fluctuating between 2 and 3 percent on a decade-to-decade basis. In the latest decade (2011–19), the global output of total crop, animal, and aquaculture commodities grew an average rate of 2.08 percent per year. Several factors contribute to output growth, including expansion of agricultural land, extension of irrigation to existing cropland, the intensification of input use (more labor, capital, and material inputs per acre), and total factor productivity (TFP), a measure of the contribution of technological and efficiency improvements in the farm sector. Before the 1990s, most output growth came from increases in input use, including expansion of land, irrigation, and intensification of other inputs. Since the 1990s, growth in TFP, rather than growth in inputs, accounted for most of the growth in world agriculture output. From 2011 to 2019, TFP globally grew at an annual rate of 1.31 percent, accounting for nearly two-thirds of output growth. This chart comes from the USDA, Economic Research Service data product International Agricultural Productivity, updated in October 2021.