

Long-term productivity growth in agriculture varies across countries
- by Keith Fuglie
- 12/10/2021
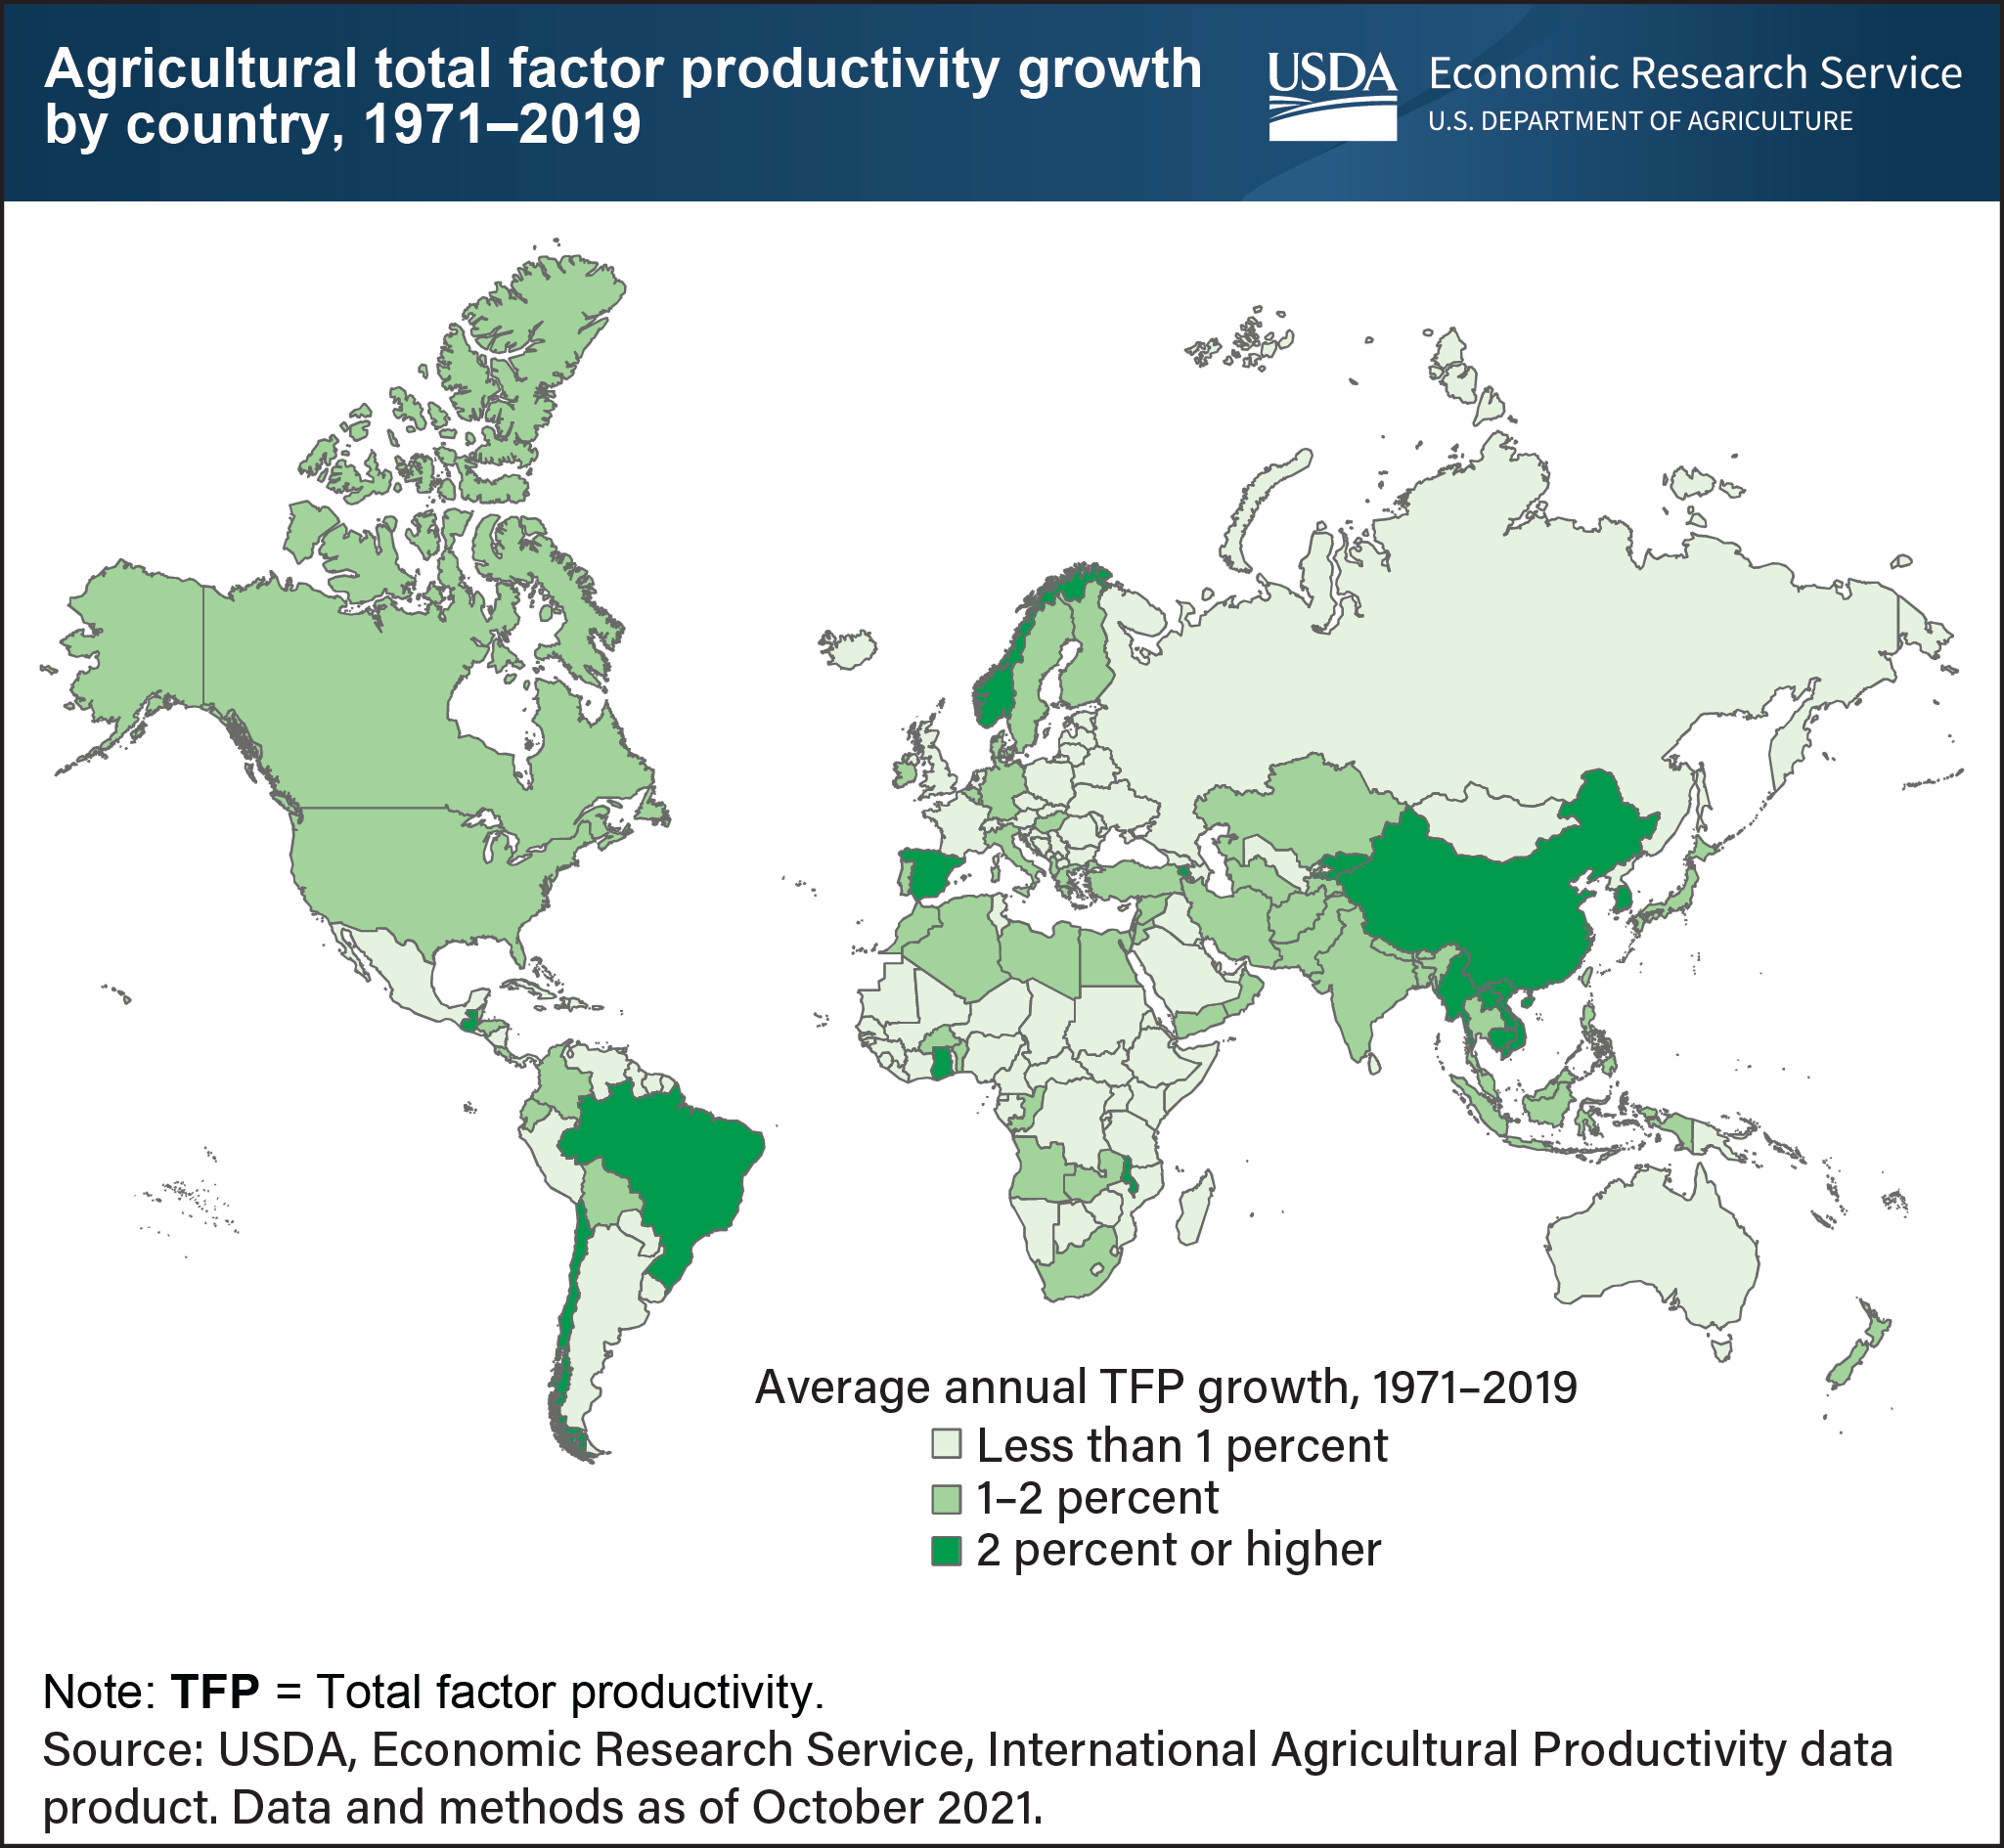
Total factor productivity (TFP) growth reflects the rate of technological and efficiency improvements in the agricultural sector and productivity growth varies across countries. TFP measures the amount of agricultural output produced from the combined set of land, labor, capital, and material resources employed in the production process. Agricultural TFP grew most rapidly (at more than 2 percent on average) in the dark green-colored countries and most slowly (or not at all) in the light green-colored countries. National policies and institutions, especially those that promote innovation and technical change, play a significant role in driving TFP growth in agriculture. Strengthening the capacity of national agricultural research and extension systems to develop and deliver new agricultural technologies to farmers has been a critical factor in raising agricultural productivity. Information from the International Agricultural Productivity data product and related ERS research show that that Brazil and India’s TFP growth can be attributed to long-term investments in agricultural research. China’s TFP growth can be attributed to investments in research and institutional and economic reforms. In contrast, Russia’s low rate of agricultural TFP growth is attributed to inefficiencies under a planned economy (until 1991) followed by economic disruptions that accompanied its transition to a market economy. Under-investment in agricultural research and extension and poor market infrastructure remain important barriers to stimulating agricultural productivity growth in Sub-Saharan Africa. This data can be found in the International Agricultural Productivity data product, last updated in October 2021.