
In fiscal year (FY) 2020, USDA’s four largest child nutrition programs provided the fewest meals since FY 2001
- by Saied Toossi
- 9/15/2021
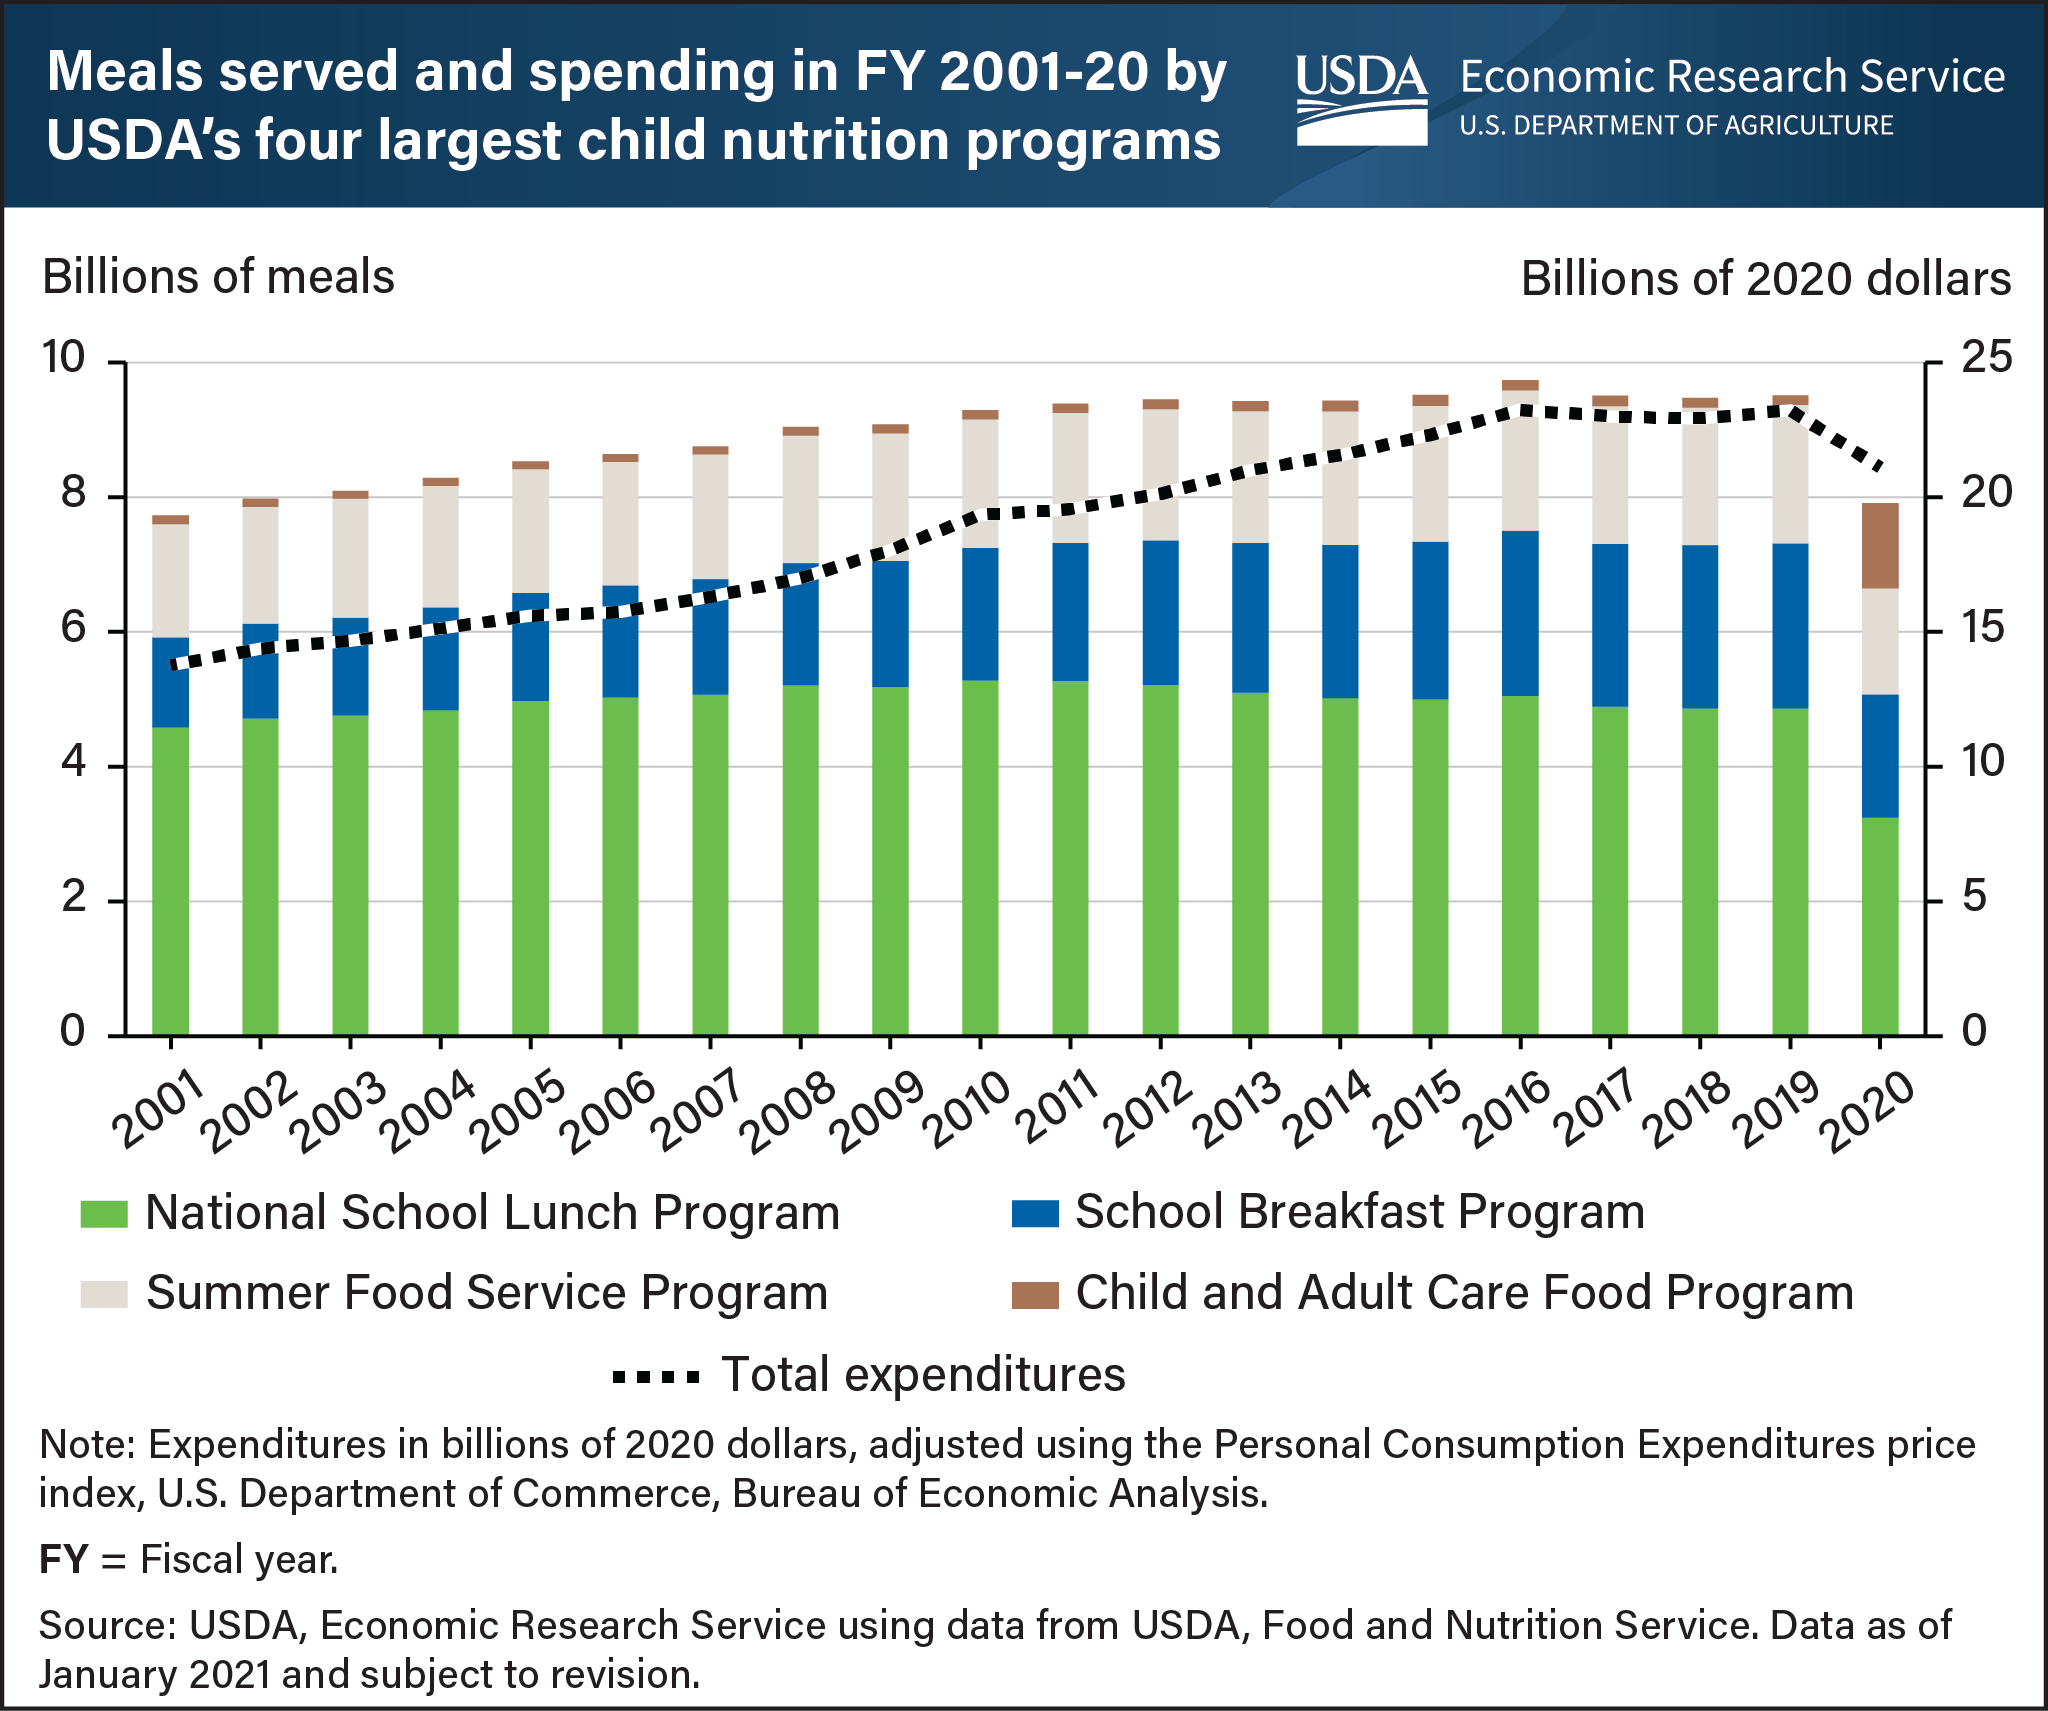
The USDA’s largest child nutrition programs—the National School Lunch Program (NSLP), School Breakfast Program (SBP), Child and Adult Care Food Program (CACFP), and Summer Food Service Program (SFSP)—served about 7.9 billion meals in fiscal year (FY) 2020, the lowest number of meals served since FY 2001. This was a 17 percent decline from the average of 9.5 billion meals served annually by the programs from FY 2015 through FY 2019. The decrease is primarily attributable to the Coronavirus (COVID-19) pandemic, which disrupted in-person attendance at schools and childcare providers—through which NSLP, SBP, and CACFP typically operate—nationwide beginning in March 2020. To help facilitate the continued provision of meals to children and adolescents during these disruptions, USDA issued waivers allowing for greater flexibility in the administration of the child nutrition programs and expanded the scope and coverage of its summer feeding programs, including SFSP. Despite the overall decline in meals served, the number of meals served through SFSP rose substantially in FY 2020. The SFSP’s share of total meals served increased to 16.0 percent in FY 2020 from 1.5 percent in FY 2019. Comparatively, NSLP’s share of meals shrank to 41.0 percent in FY 2020 from 51.2 percent in FY 2019. Though less drastic, SBP’s and CACFP’s share of all meals served also decreased, to 23.1 percent in FY 2020 from 25.8 percent in FY 2019 for SBP and 19.8 percent in FY 2020 from 21.6 percent in FY 2019 for CACFP. Because of disruptions and changes to the child nutrition landscape in FY 2020, total spending on all four programs amounted to $21.1 billion, down from average annual expenditures of $22.9 billion in the previous five fiscal years. This chart is based on a chart in the USDA, Economic Research Service’s The Food and Nutrition Assistance Landscape: Fiscal Year 2020 Annual Report.