
China’s rejection of food shipments from U.S. and European Union may have depended on product mix
- by Fred Gale
- 4/9/2021
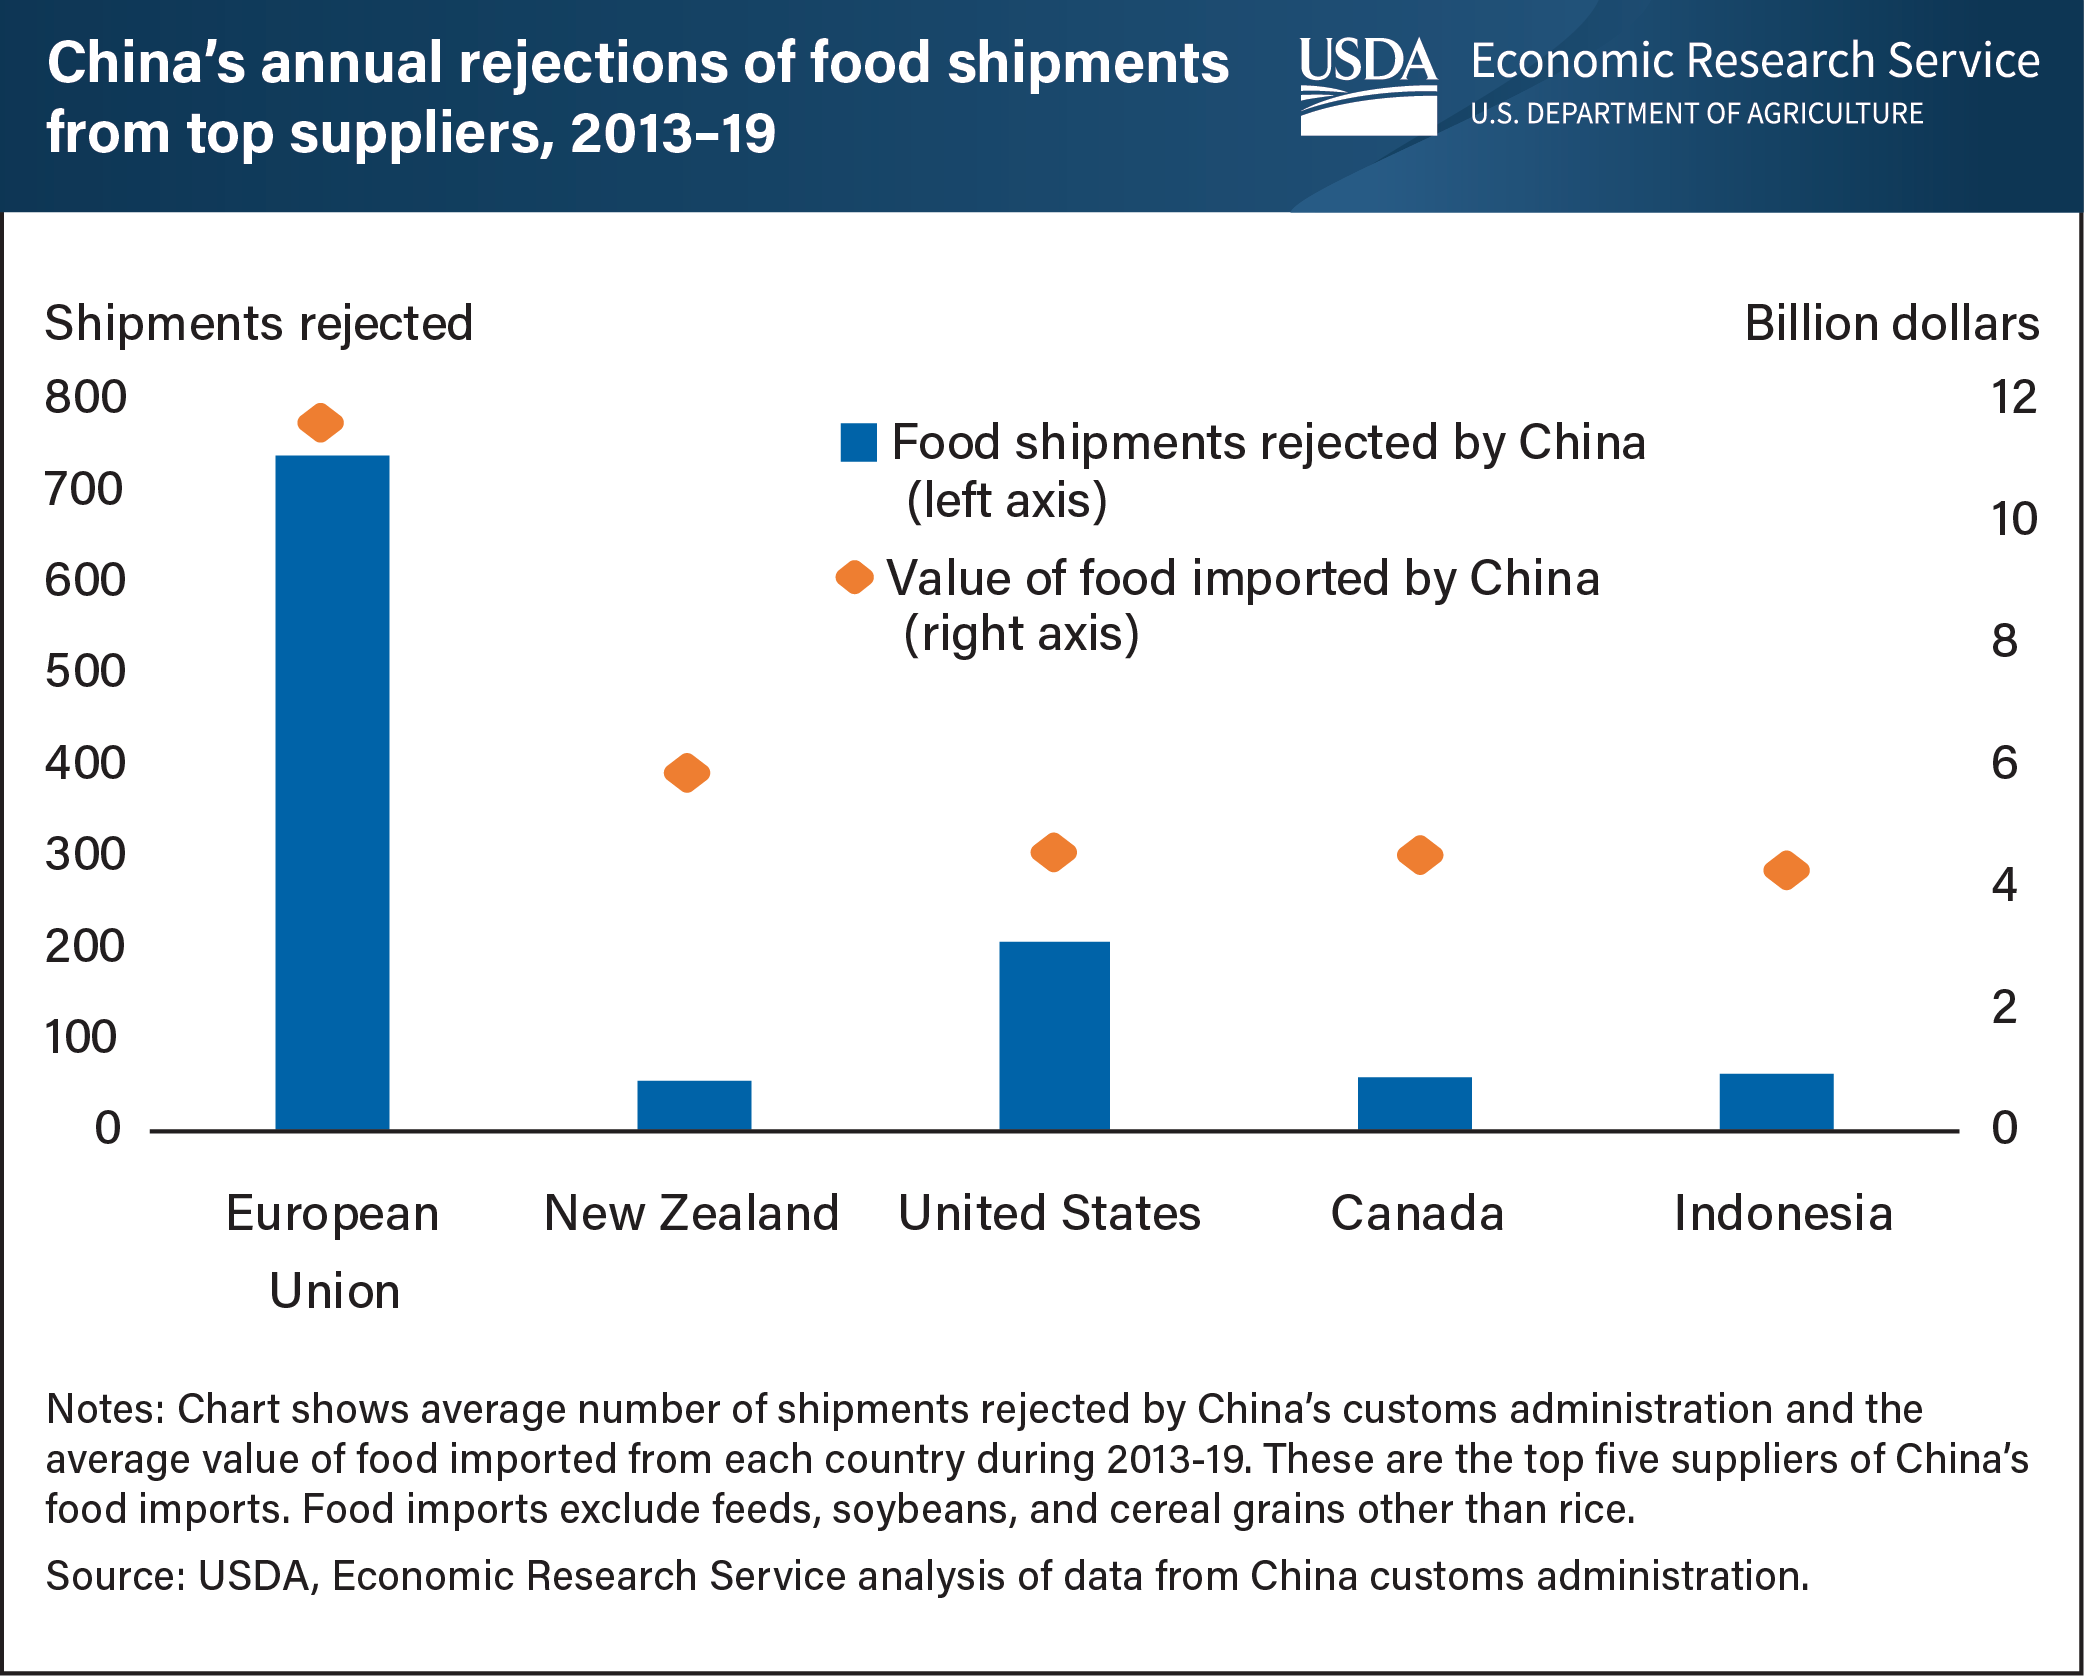
China’s inspectors destroy or turn away almost 3,000 foreign food shipments annually for reasons such as lacking proper documentation, failing to meet labeling requirements, or having obvious damage or sanitation problems. Research conducted by USDA’s Economic Research Service shows China is more likely to reject consumer-ready packaged items such as baking products, snacks, health food, wine, and other beverages. These consumer-oriented items comprise a relatively large share of food imports from the European Union (EU) and United States, the two countries with the largest average annual number of rejections. China rejected an average of 207 U.S. food shipments annually during 2013–19, far fewer than the 740 European Union (EU) shipments refused annually. The large number of EU rejections is consistent with its status as leading supplier of China’s food imports with an average of $11.6 billion annually. The United States was the third-leading supplier, with an average of $4.6 billion (excluding soybeans, feeds and other agricultural items not used directly as food). However, the average annual number of rejected shipments (fewer than 60) from New Zealand, Canada, and Indonesia was low compared with the value of China’s imports from those countries. A factor influencing the number of China’s rejections is the mix of food products China imports from the EU and the United States. Consumer-ready products such as those from the EU and the United States tend to be rejected with higher frequency than products shipped in bulk such as powdered milk, canola, fresh fruit, and vegetable oil that China imports from other major food-supplying countries. This chart is drawn from the USDA, Economic Research Service report, China’s Refusal of Food Imports, March 2021.