

In early May 2023, retail food sales values were above the previous year for most categories
- by Alexander Stevens
- 8/8/2023
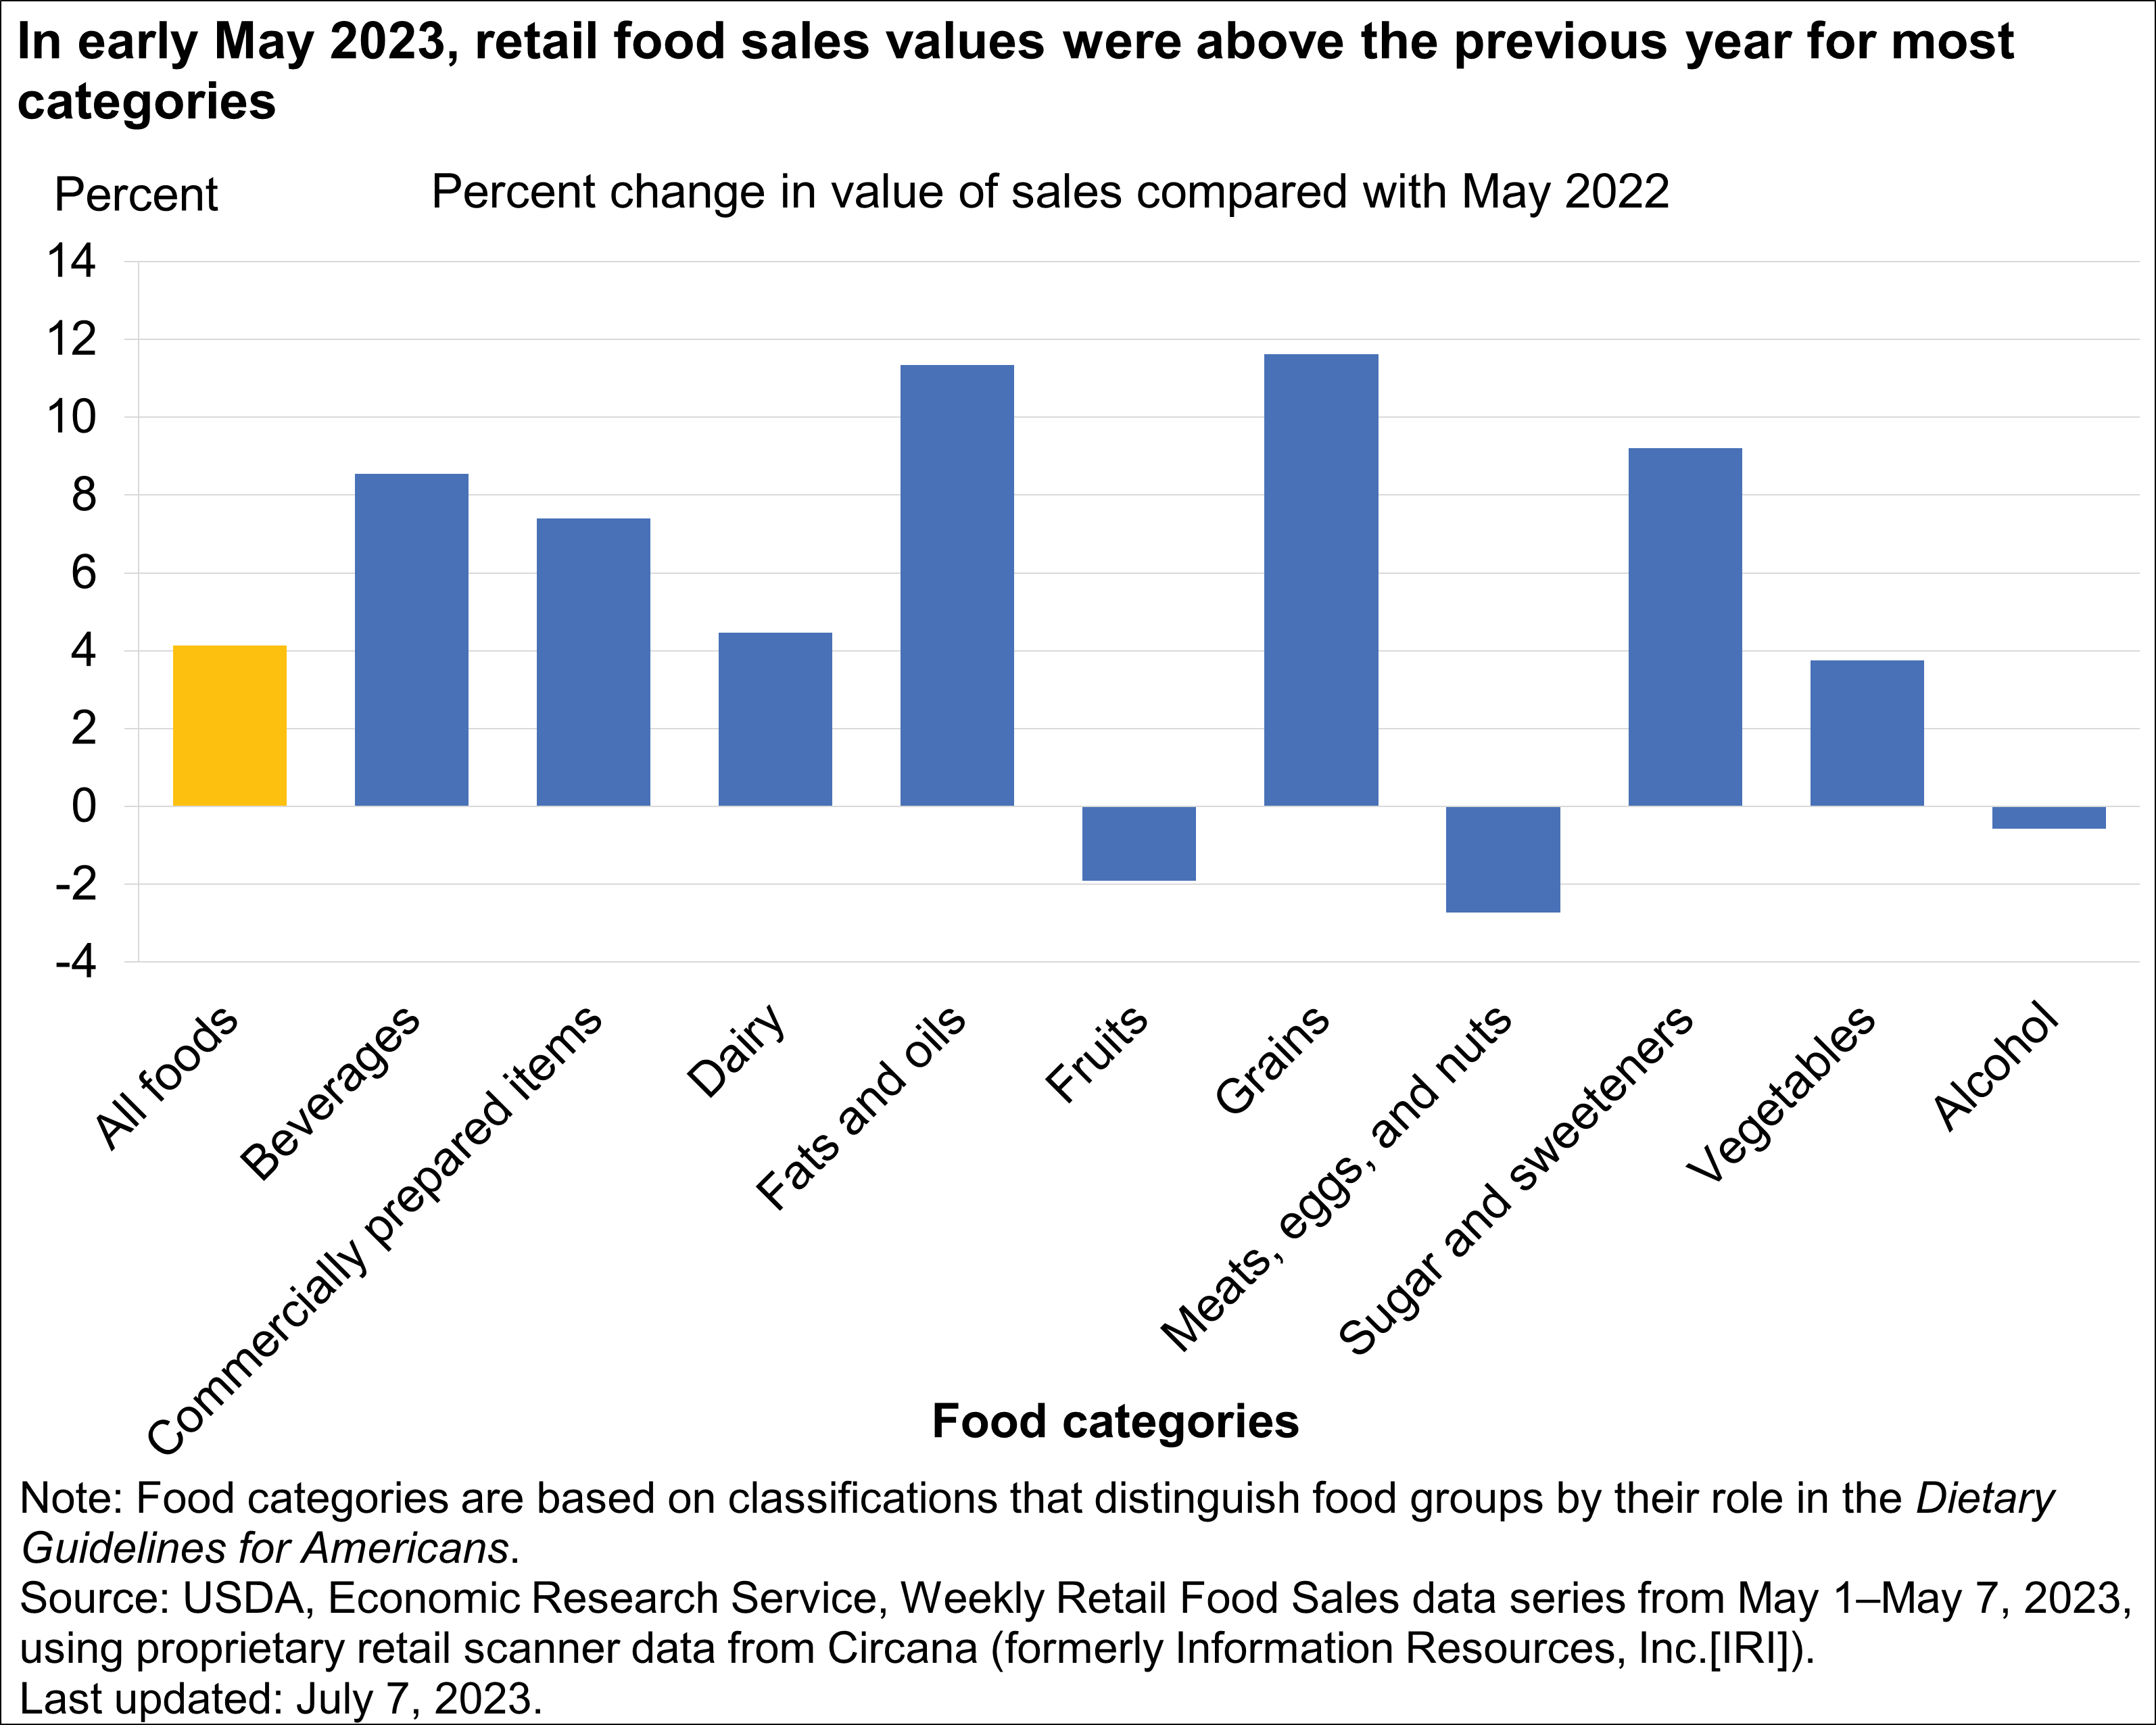
This chart provides retail food sales comparisons with the same week 1 year prior in order to illustrate how sales changed during the Coronavirus (COVID-19) pandemic. As of May 7, 2023, the value of sales was 4.1 percent higher than the same week in 2022, with wide variations across food categories. The highest increase was for grains—11.6 percent higher compared with the same week in 2022—whereas meats, eggs, and nuts were 2.7 percent lower.