
China's refusals shifted from U.S. and European products to foods from other countries during 2020
- by Fred Gale
- 5/3/2021
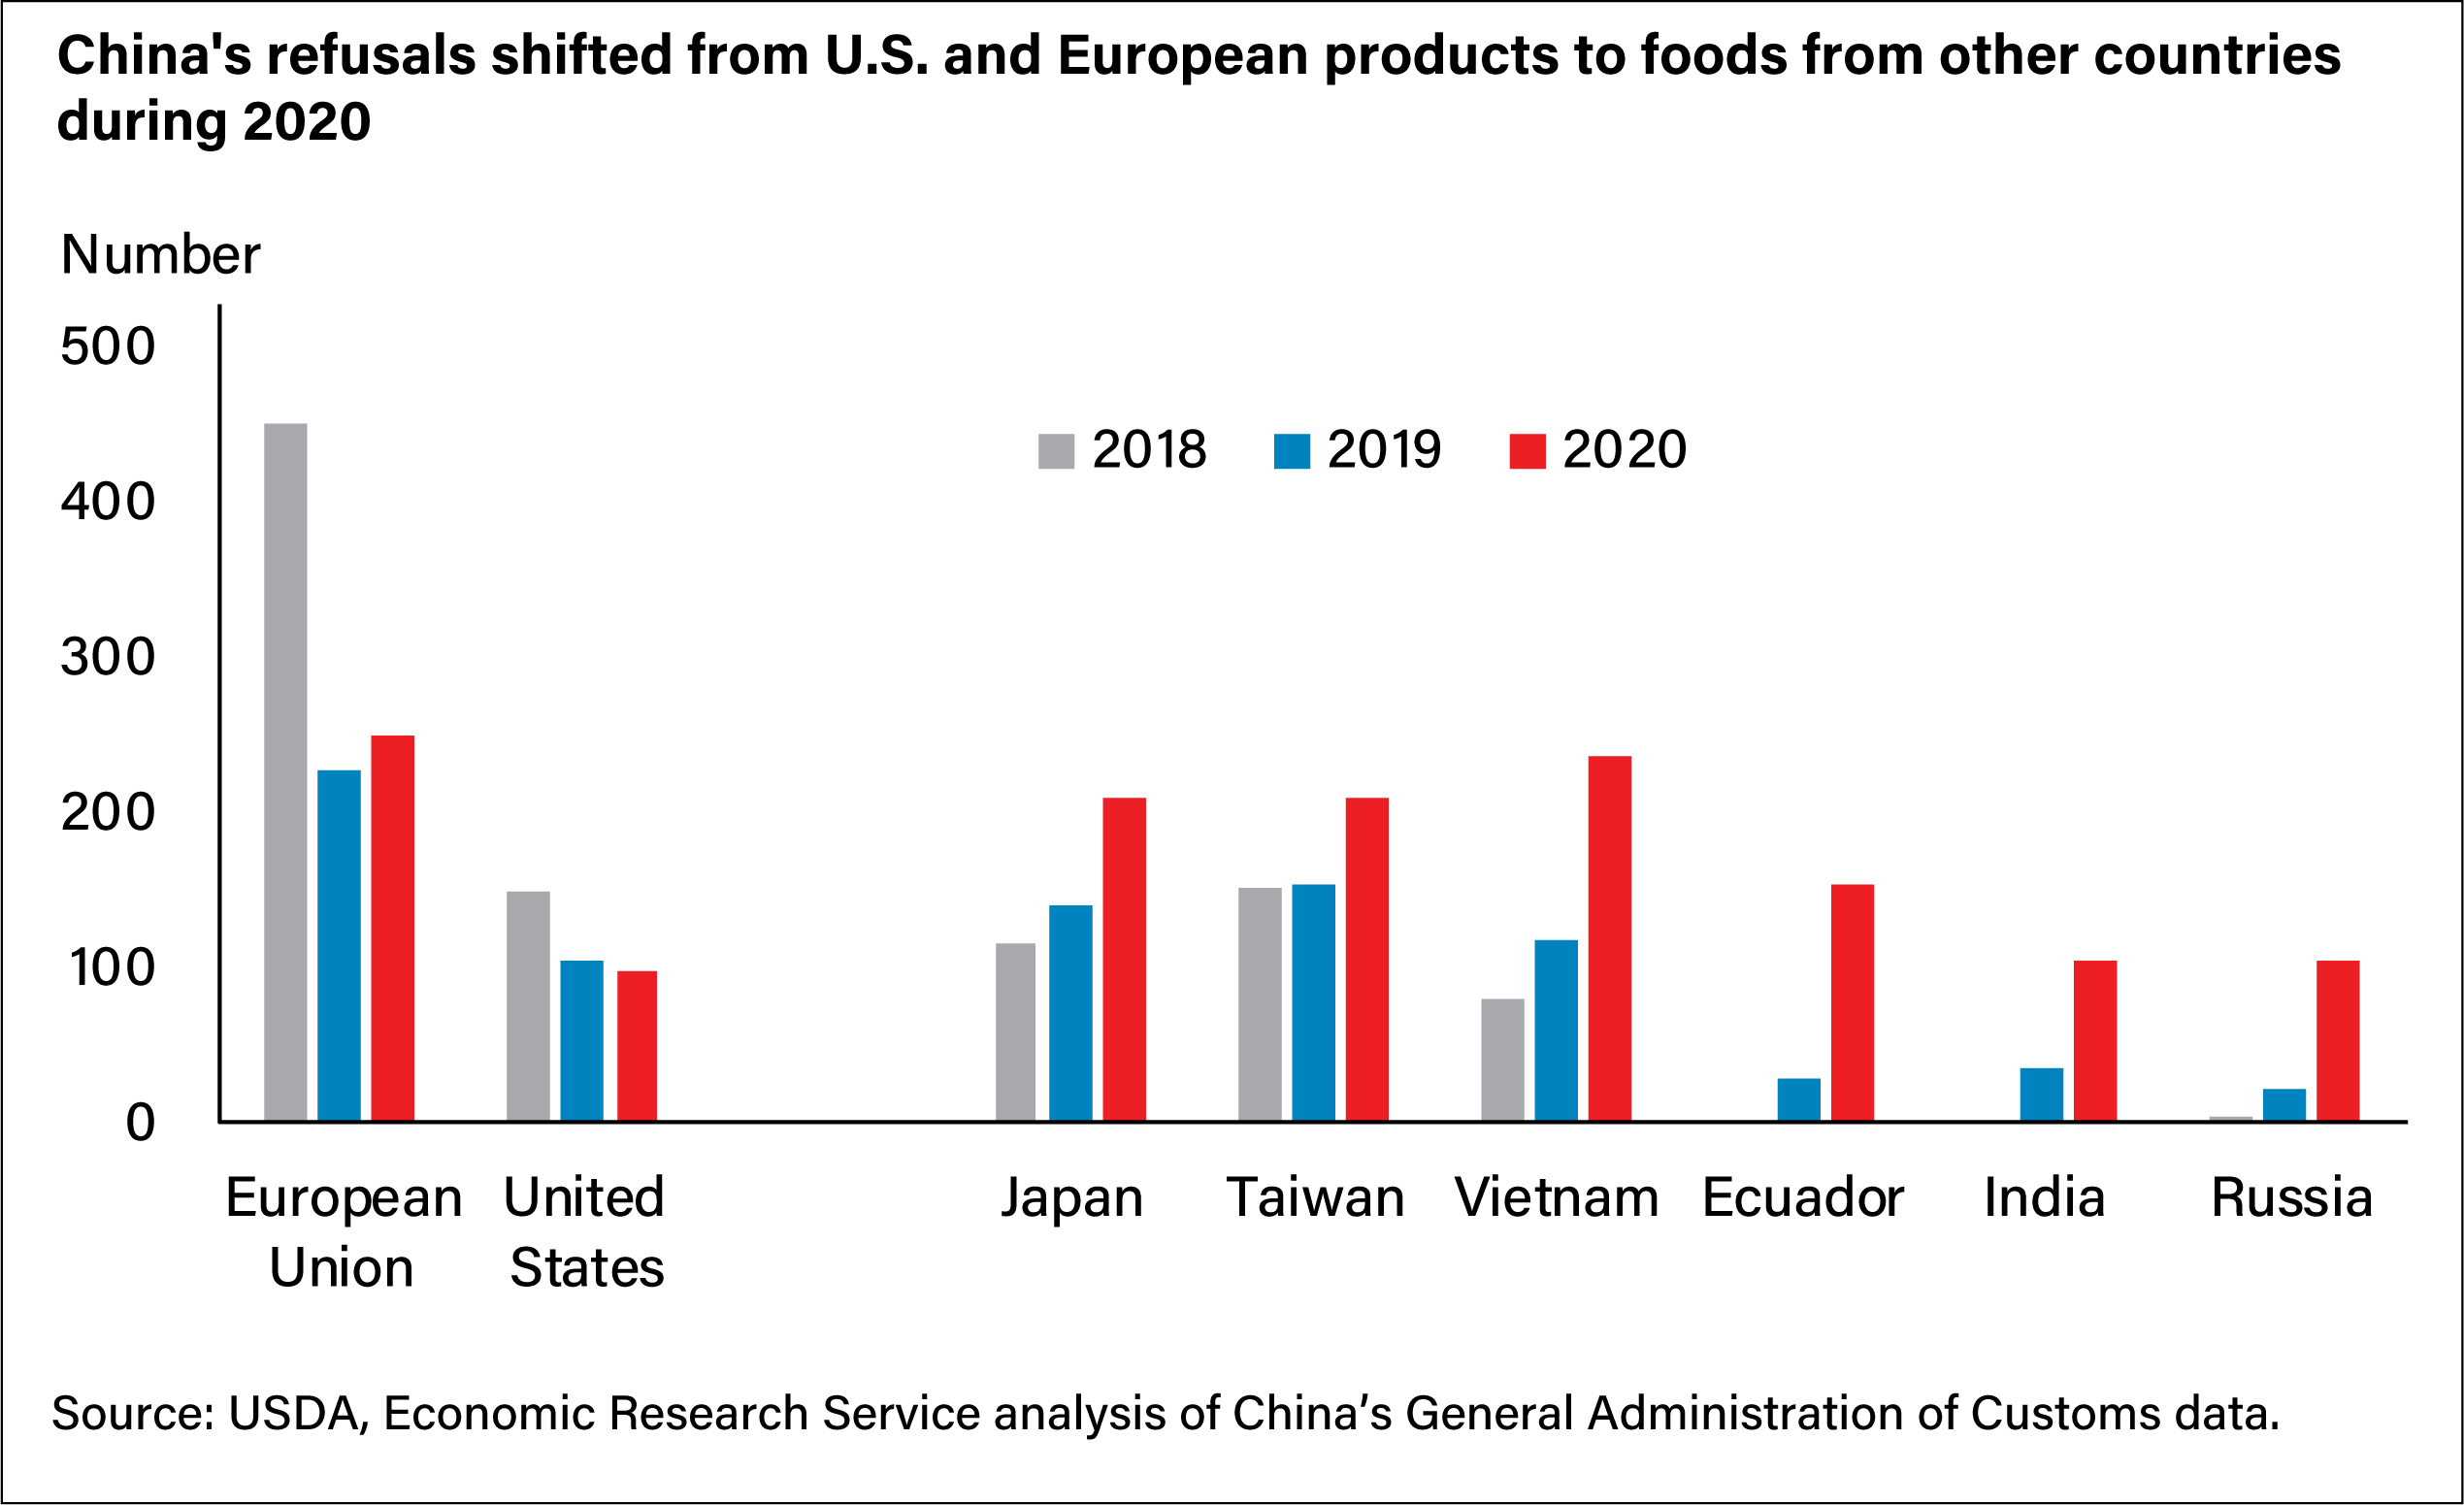
A bar chart showing the annual number of China’s rejections of imports by country from 2018-20 indicating higher rates of rejection of EU and U.S. imports in 2018 but higher rates of rejection by smaller countries in 2020.
We’d welcome your feedback!
Would you be willing to answer a few quick questions about your experience?