



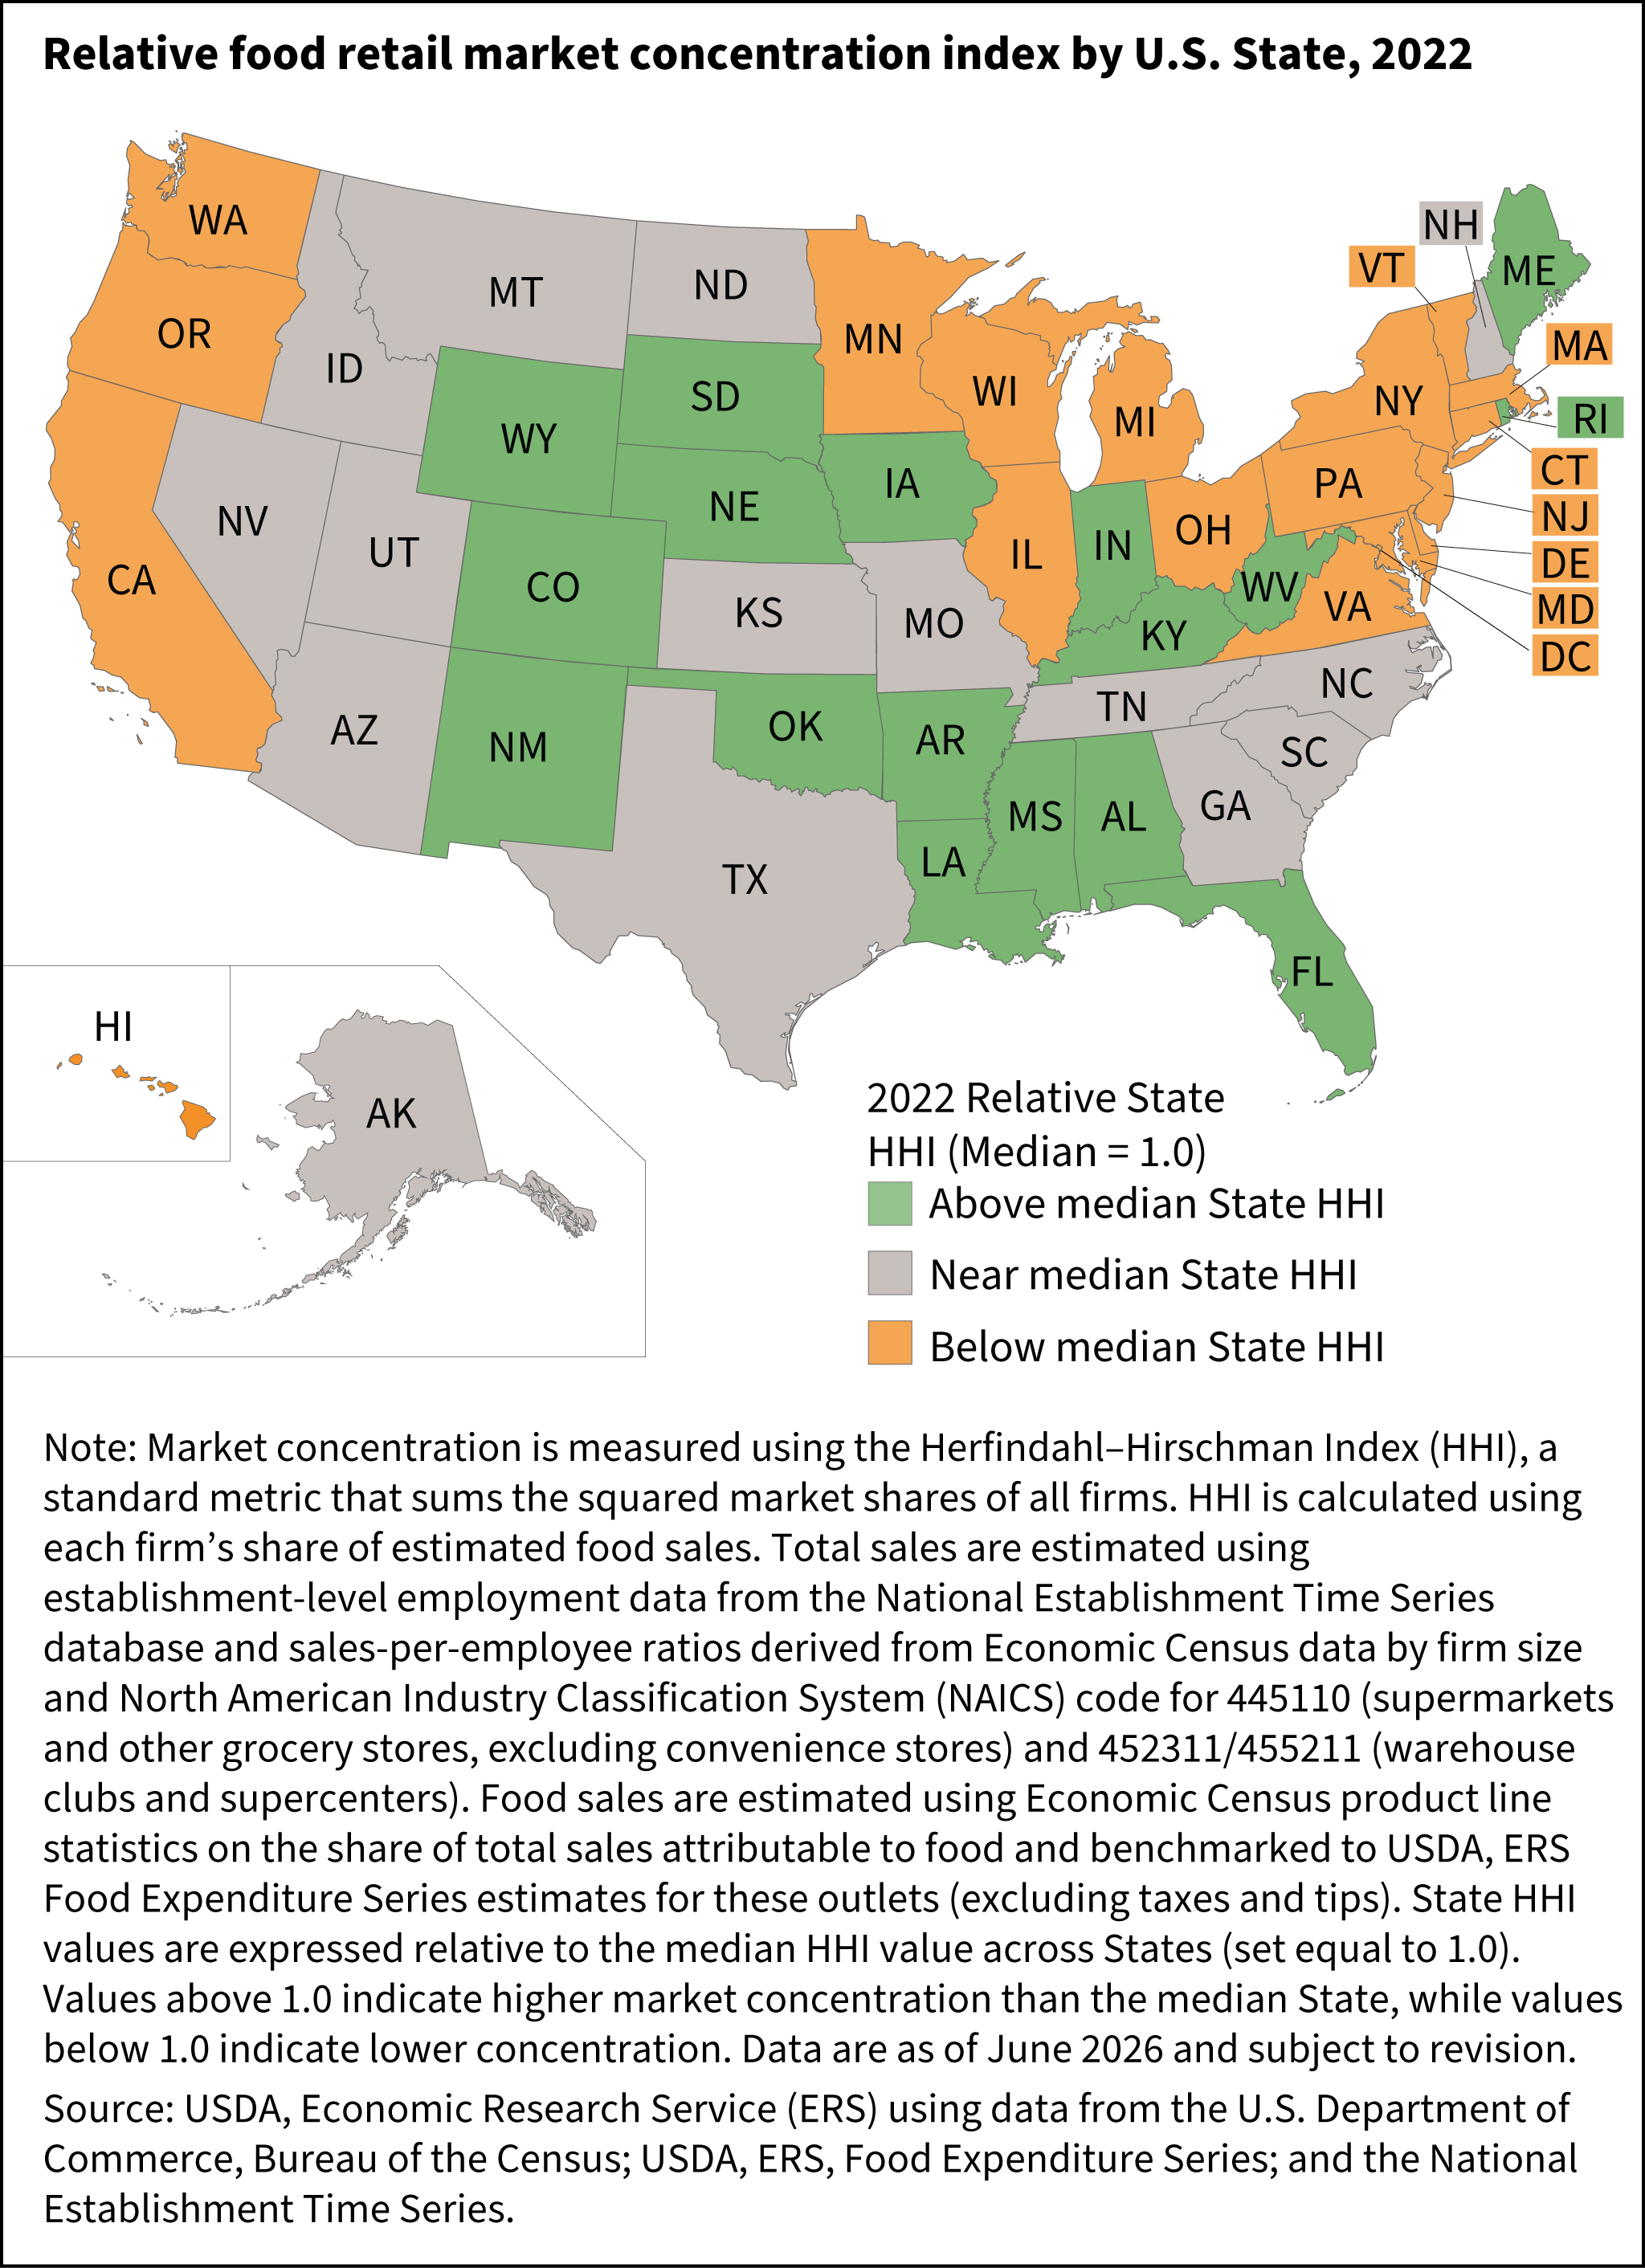
Relative food retail market concentration index by U.S. State, 2022
- by Eliana Zeballos and Wilson Sinclair
- 8/17/2026
Download chart image | Chart data
U.S. map showing relative food retail market concentration across U.S. States in 2022 using the Herfindahl-Hirschman Index (HHI). HHI values are calculated from estimated food sales for supermarkets, other grocery stores, warehouse clubs, and supercenters and are expressed relative to the median State HHI (set equal to 1.0).
We’d welcome your feedback!
Would you be willing to answer a few quick questions about your experience?