



Irrigated acreage has shifted East since 1997, though total U.S. irrigated acreage has remained flat
- by Nicholas Potter
- 1/9/2026
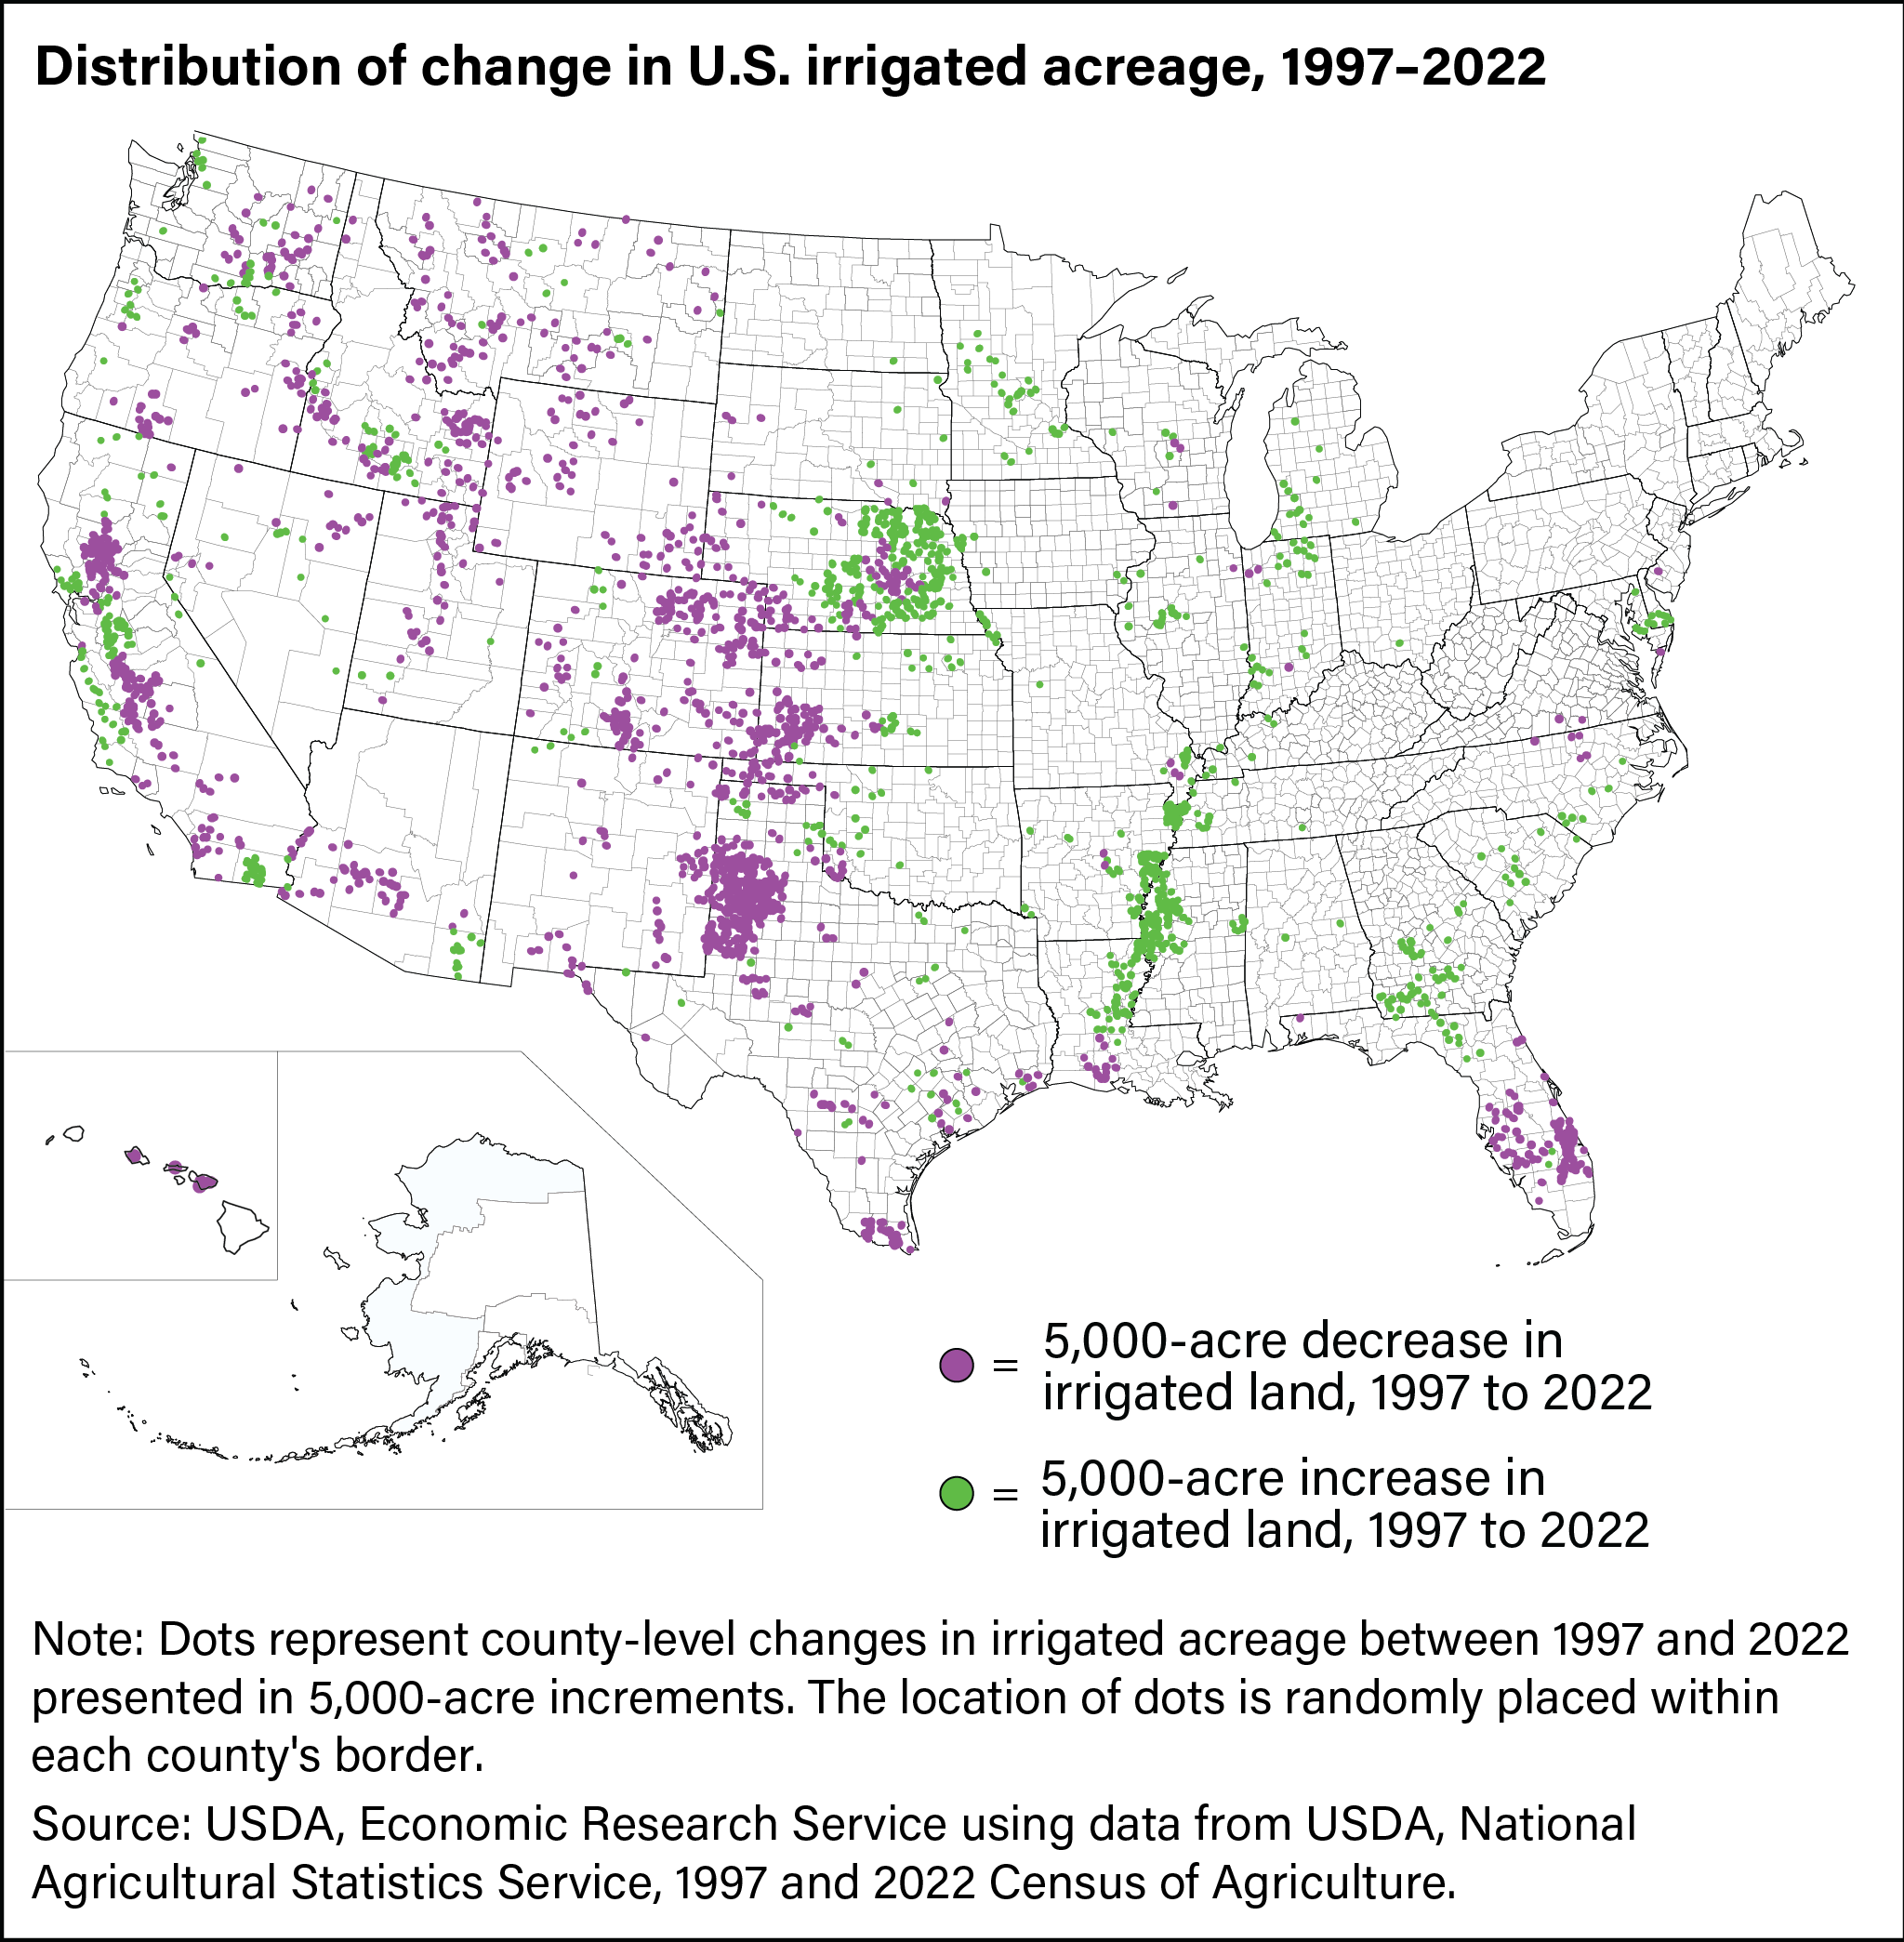
In the United States, 54.9 million acres were irrigated in 2022, down slightly from 56.3 million acres in 1997. This modest decline conceals significant regional changes in recent decades. California’s irrigated acreage decreased from 8.8 to 8.2 million acres between 1997 and 2022, while irrigated land in Nebraska increased from 7 to 8 million acres. Arkansas added more than 1 million acres while Texas saw a decline of nearly 2 million acres. By 2012, Arkansas surpassed Texas as the State with the third-most irrigated acres, behind Nebraska and California. The decrease in irrigated area in the West—where a generally arid climate means most crops require irrigation—primarily reflects surface and groundwater shortages due to drought and groundwater depletion in the face of competing demands for water. In some areas, urbanization has also contributed to this shift. The increase in irrigation in historically rain-fed eastern agricultural regions largely reflects the benefits of irrigation in areas with unreliable rainfall.
We’d welcome your feedback!
Would you be willing to answer a few quick questions about your experience?