



When adjusted, body mass index (BMI) based on self-reported height and weight in scanner data better aligns with measured data
- by Abigail Okrent, Megan Sweitzer, Sabrina Young and Elina T. Page
- 11/20/2023
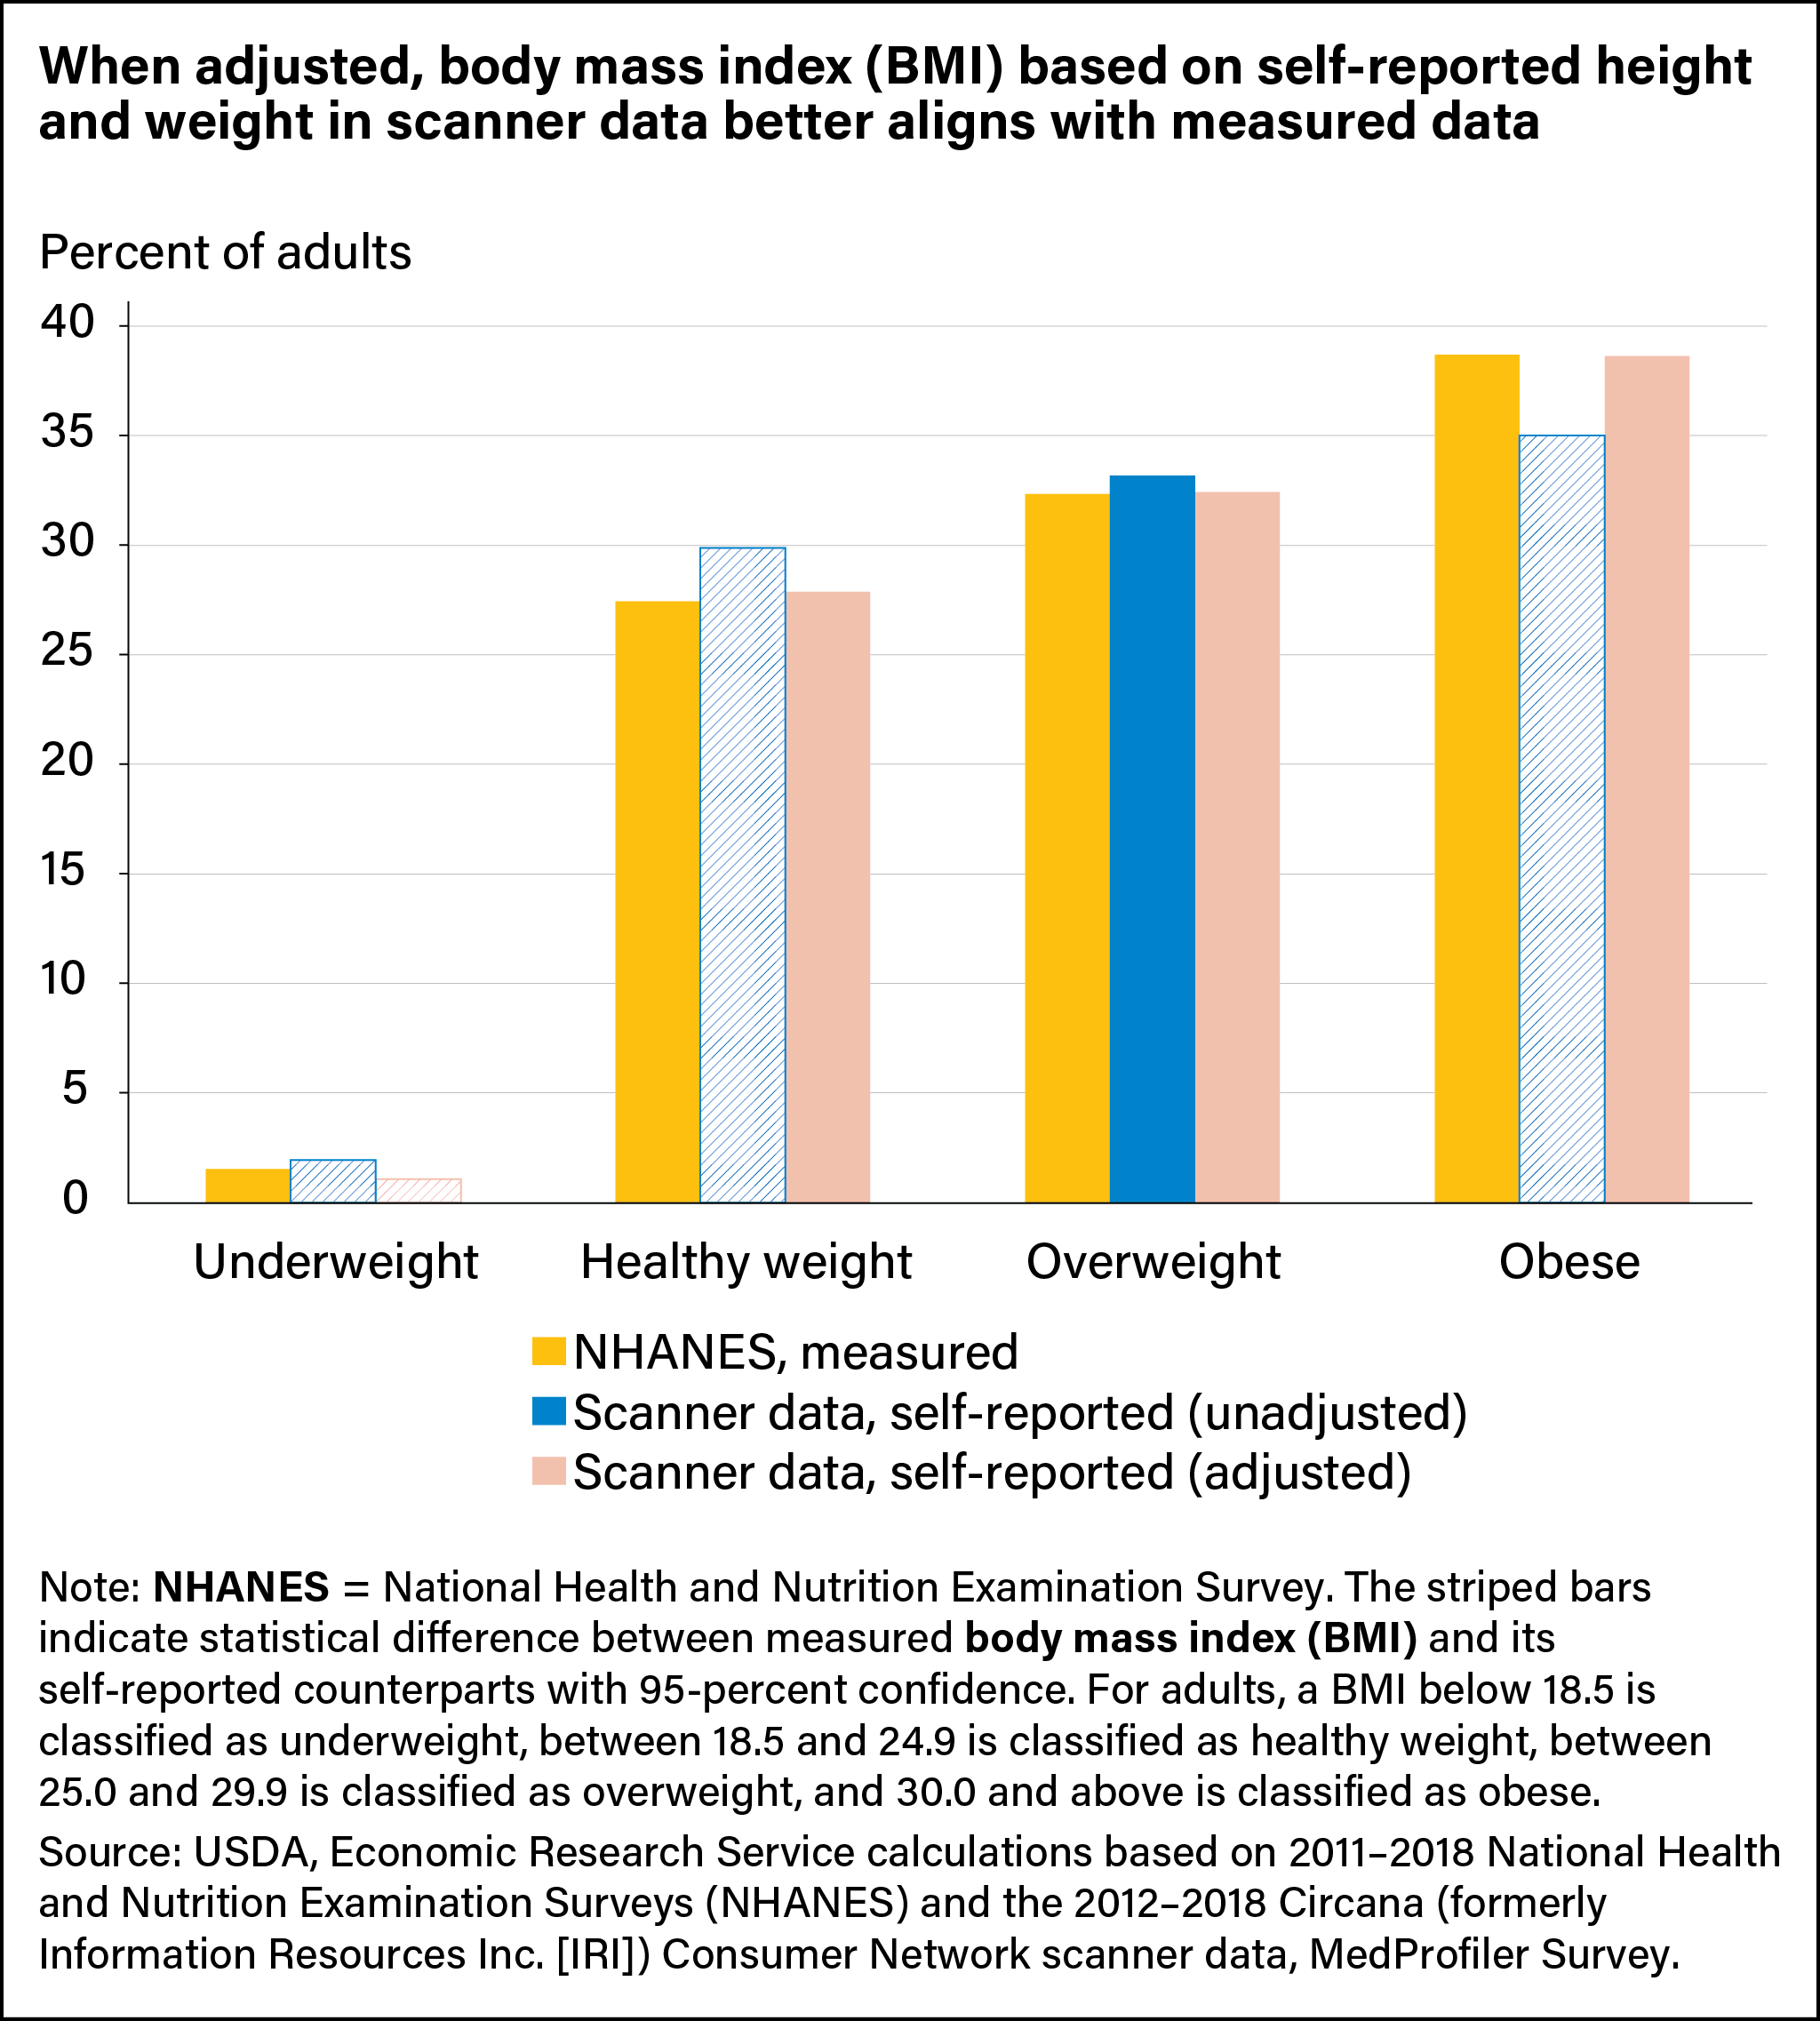
Most surveys to determine obesity rates using body mass index (BMI) rely on self-reported height and weight, which often can be misreported. Using both self-reported and measured heights and weights from the National Health and Nutrition Examination Survey (NHANES), self-reported information in scanner data can be adjusted to reduce measurement error.
We’d welcome your feedback!
Would you be willing to answer a few quick questions about your experience?