Satisfying Fruit and Vegetable Recommendations Possible for Under $3 a Day, Data Analysis Shows
- by Sabrina Young, Jeffrey Hyman and Hayden Stewart
- 9/9/2024
USDA, Economic Research Service’s (ERS) Fruit and Vegetable Prices data product reports the average cost for a U.S. household to buy more than 150 fresh and processed fruit and vegetable products. Reported estimates include each product's average retail price per edible cup equivalent—the unit of measurement in which Federal dietary recommendations for both food groups are stated. According to the Dietary Guidelines for Americans, 2020–2025, most individuals need to consume more fruit and vegetables. About 90 percent eat too few vegetables, according to the Guidelines, and 80 percent do not eat enough fruit. Individuals choose foods based on taste, convenience, and other factors. Cost has been cited in particular as a possible barrier to increasing fruit and vegetable intake.
In May 2024, ERS updated cost estimates for 24 fresh fruits, 42 fresh vegetables, 38 processed fruits, and 51 processed vegetables. All estimates are based on 2022 retail scanner data from Circana (formerly Information Resources Inc. (IRI)). ERS plans to update the Fruit and Vegetable Prices data product annually as the necessary data become available.
Every 5 years, USDA and the U.S. Department of Health and Human Services release a new version of the Dietary Guidelines for Americans with information about the foods recommended for individuals to consume for a healthy diet. The current recommendation is 2 cup equivalents of fruit and 2.5 cup equivalents of vegetables per day for someone on a 2,000-calorie-per-day diet. One cup equivalent generally is the amount of edible fruit or vegetable—minus core, seeds, or peel—that will fit in a standard 1-cup measuring cup. But that is not always the case. For example, for lettuce and other raw leafy vegetables, a cup equivalent is 2 cups. It is one-half cup for raisins and other dried fruits.
ERS Calculates Average Cost to Consume More Than 150 Fruits and Vegetables
ERS used 2022 retail scanner data from Circana to calculate national-average retail prices for each of the 155 different fruit and vegetable products. Estimates are calculated for each product as it is sold in grocery stores on a dollars-per-pound basis or, in the case of juice, on a dollars-per-pint basis. To convert average retail prices into costs per cup equivalent, ERS researchers made adjustments for the removal of inedible parts and cooking loss that typically occur before consumption. For example, fresh potatoes lose about 19 percent of their retail weight when baked. For a fresh orange, weight adjustments are made for the removal of peel and seeds.
Fruit and Vegetable Costs per Cup Equivalent Vary Widely
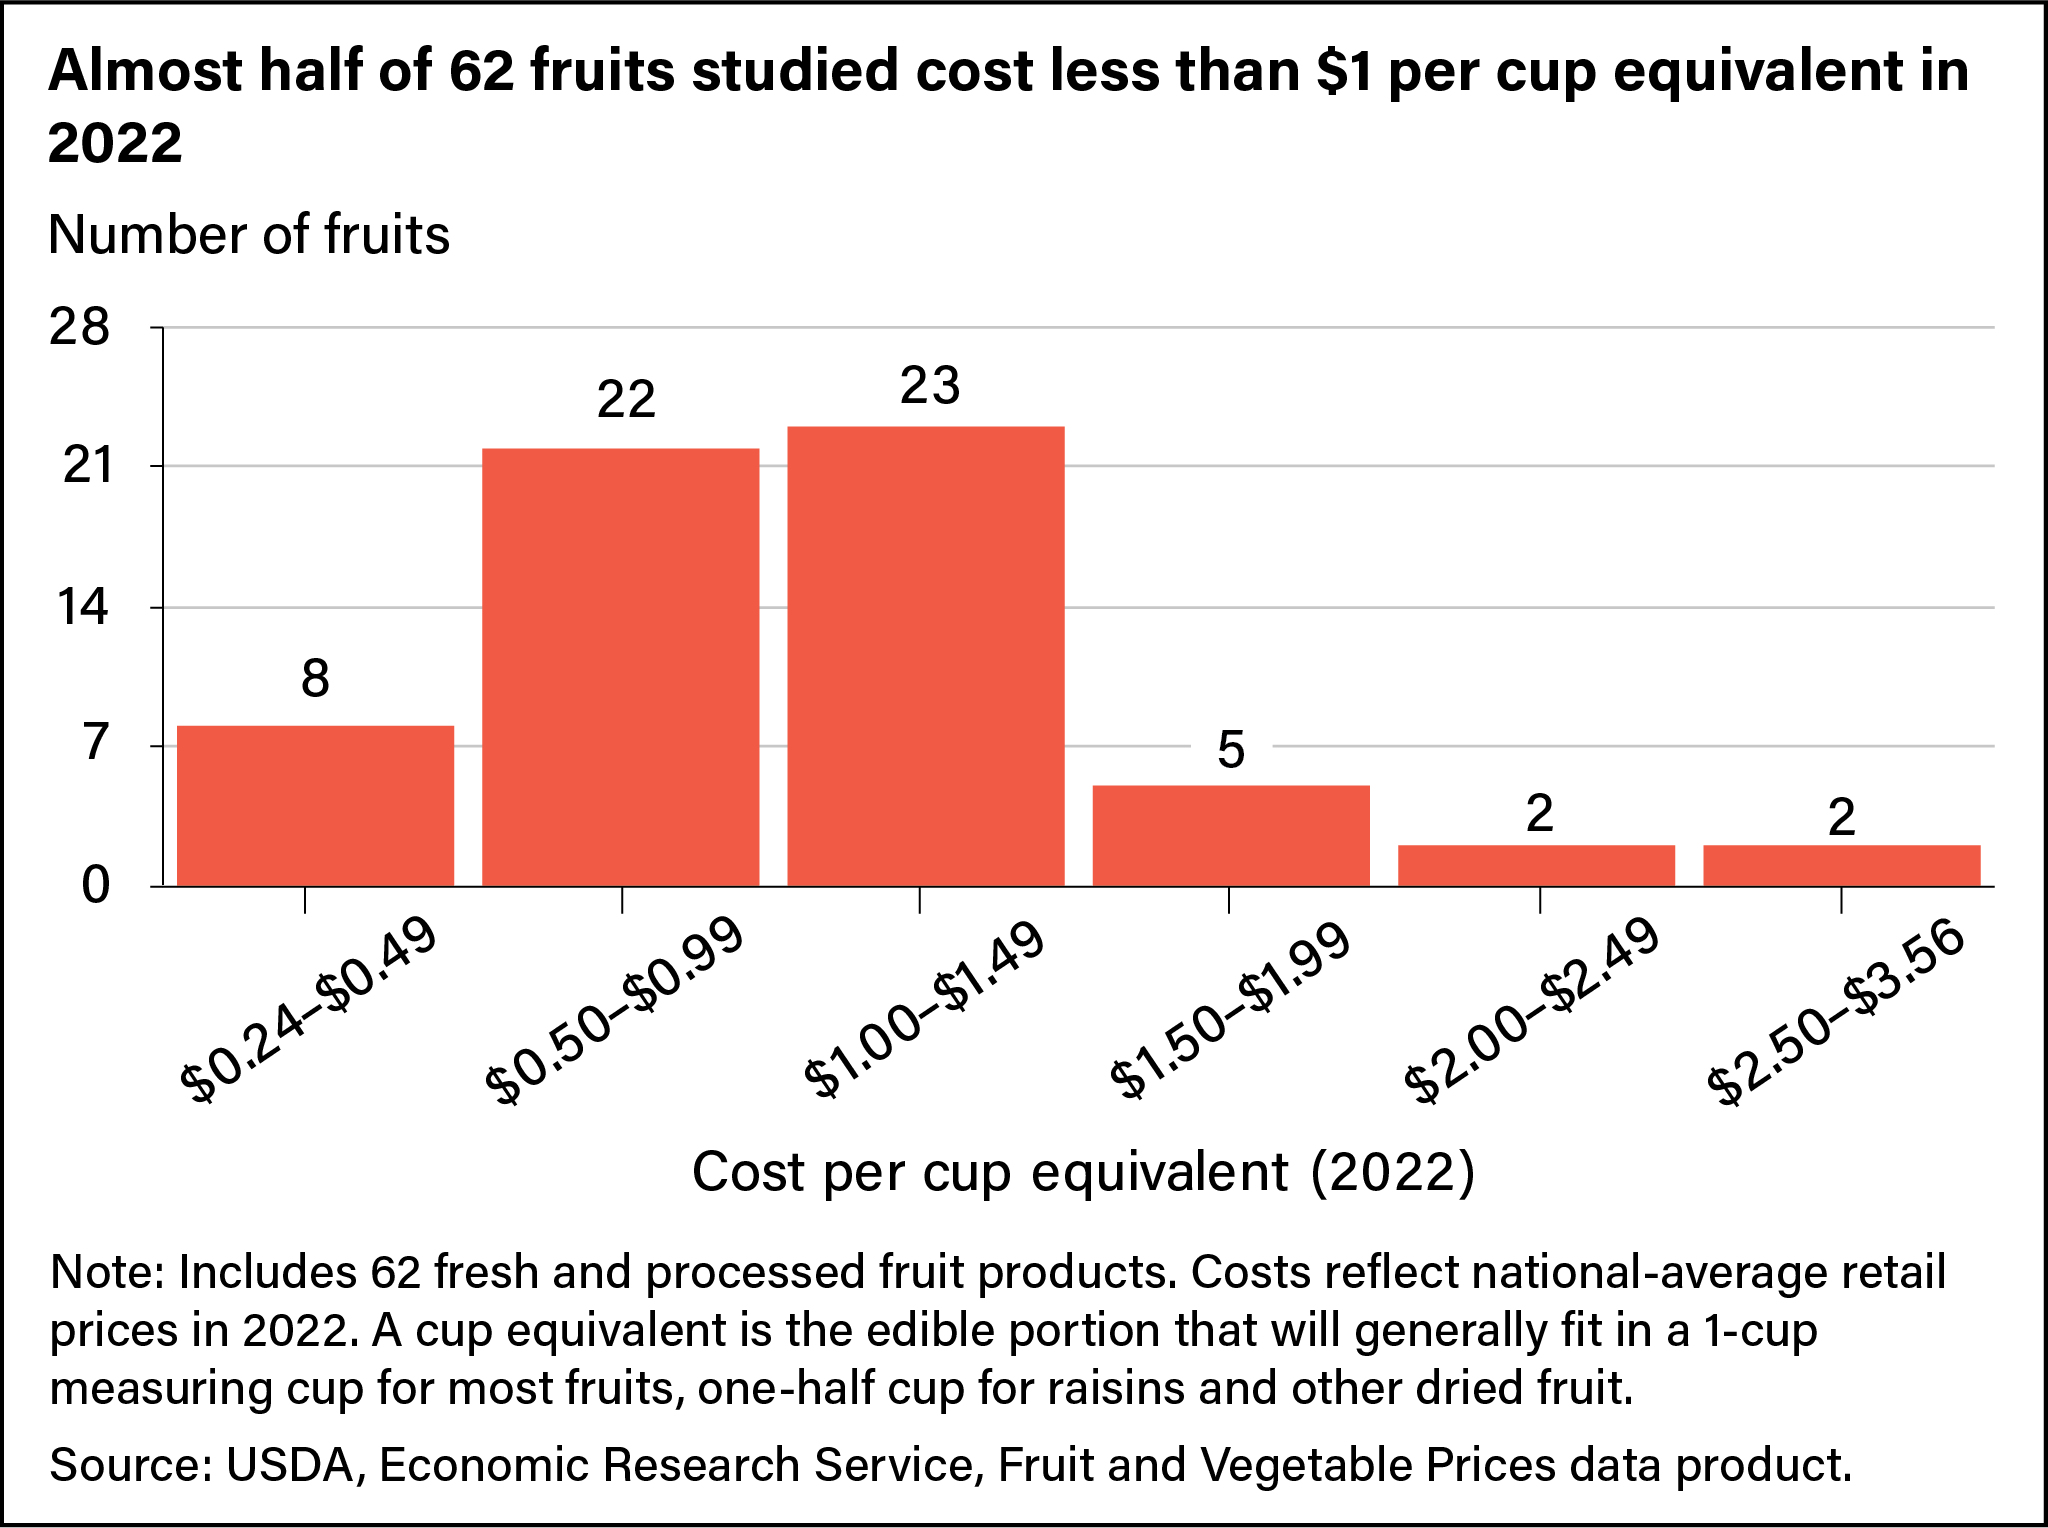
When expressed in cup equivalents, 8 out of the 62 fresh and processed fruit products cost less than 50 cents per cup equivalent in 2022. Fresh watermelon at 24 cents and frozen concentrated apple juice at 30 cents were the least expensive. Twenty-two products cost between 50 cents and 99 cents per cup equivalent. These included fresh apples (50 cents), ready-to-drink orange juice (53 cents), raisins (66 cents), and fresh oranges (88 cents). In 2022, the most expensive fruit product for U.S. consumers was canned cherries at $3.56 per cup equivalent.
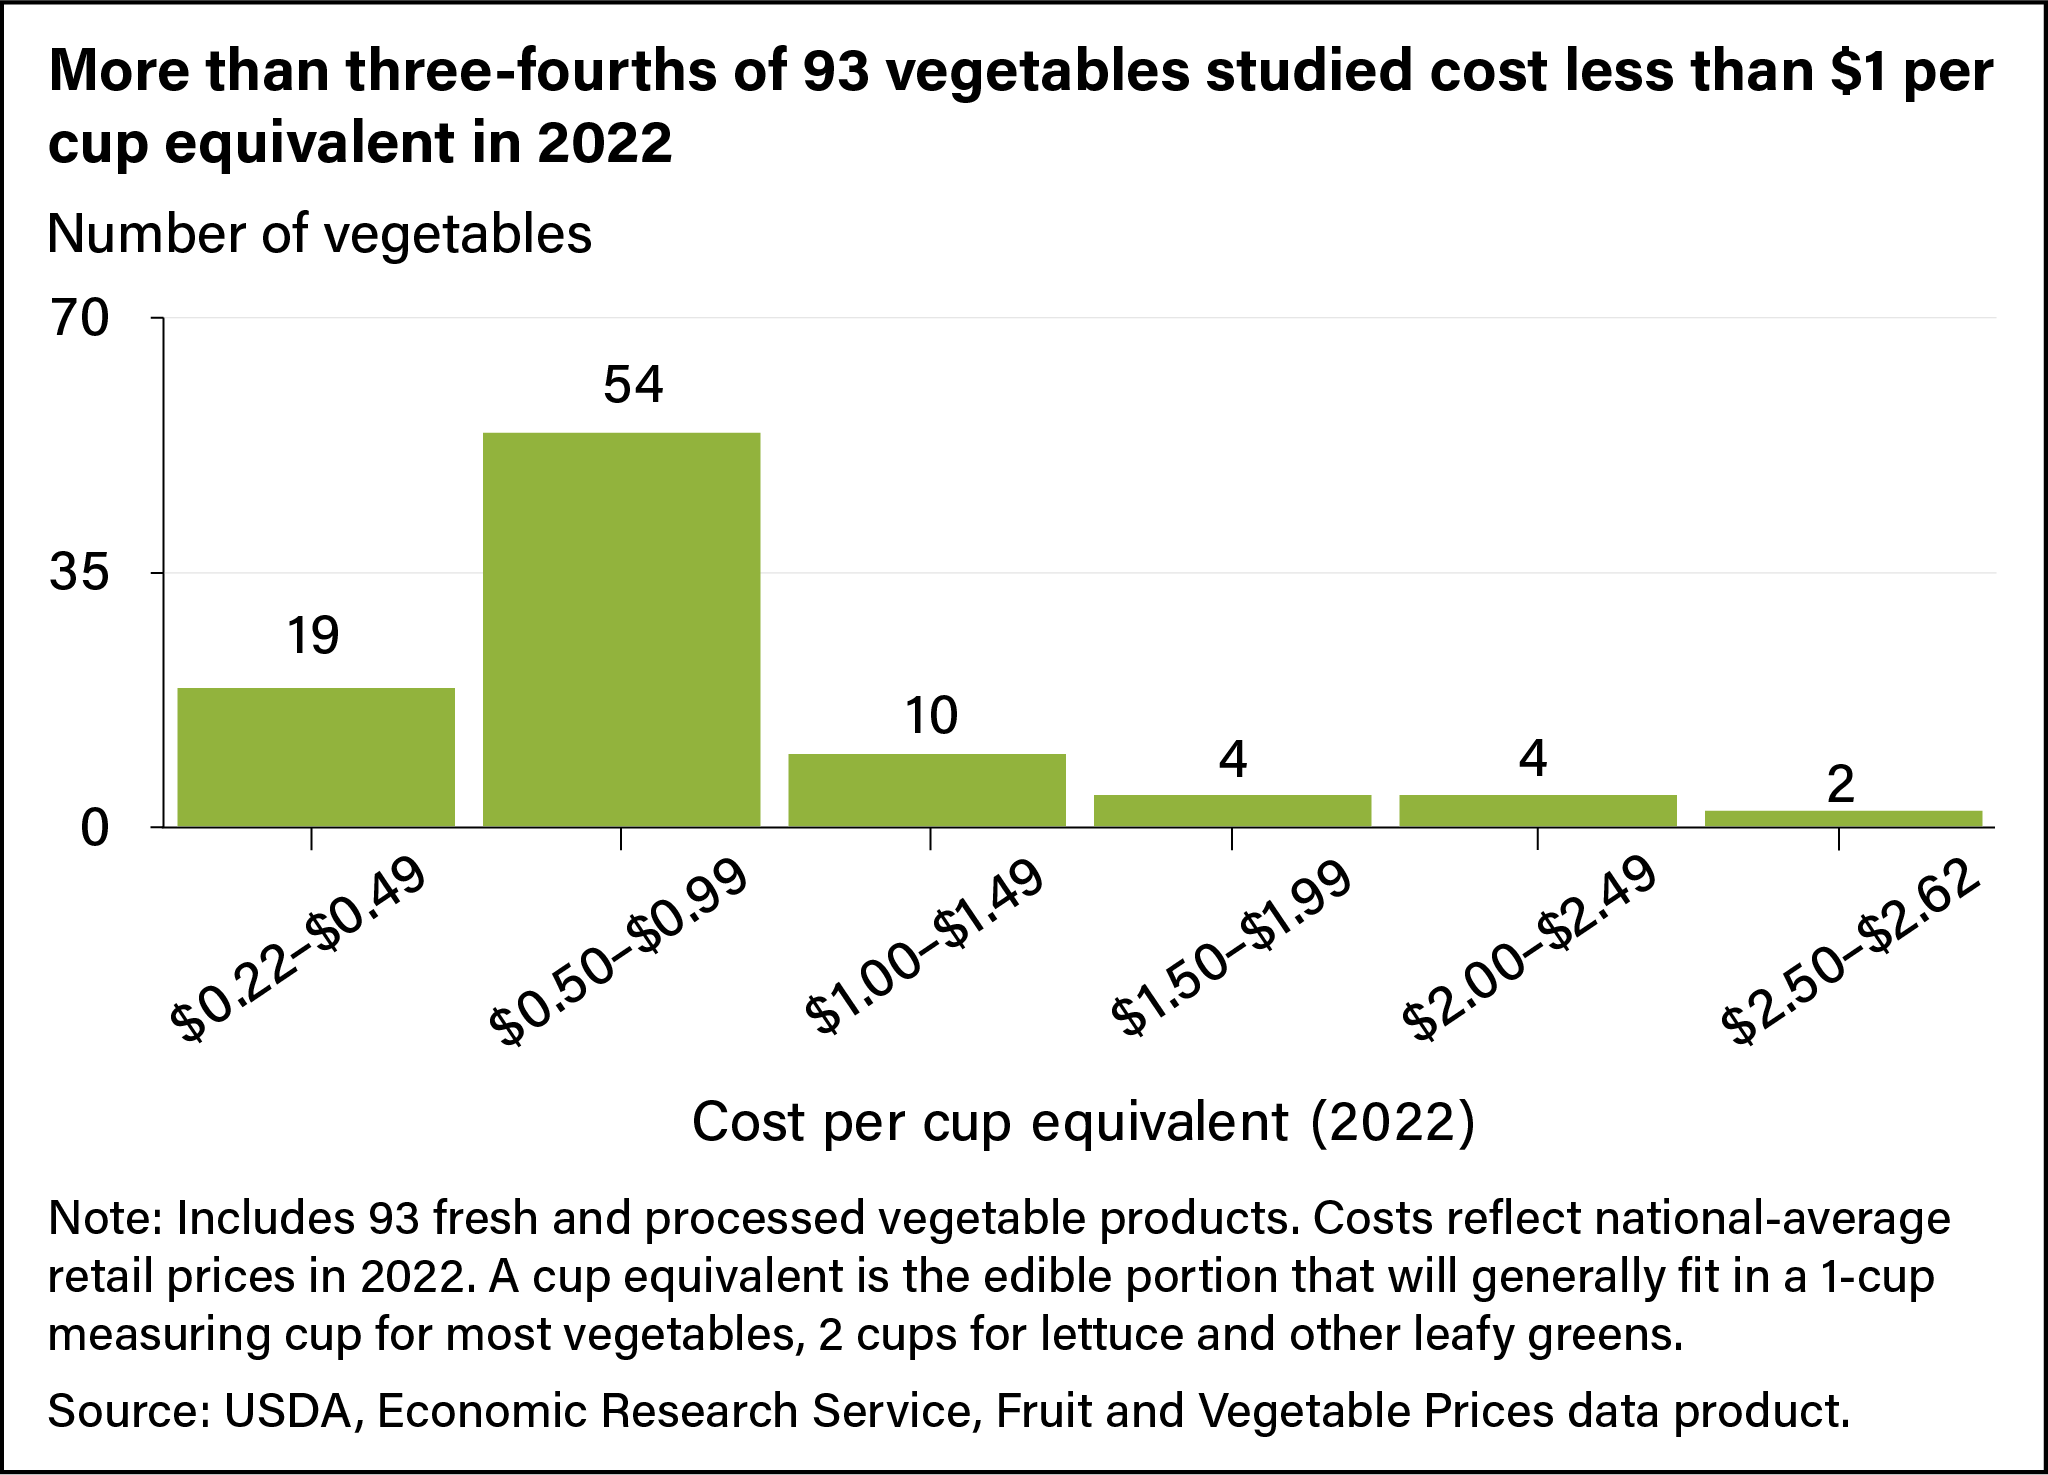
Among all 93 vegetable products priced by researchers, ERS found that 19 cost less than 50 cents per cup equivalent in 2022 including baked white potatoes (27 cents), iceberg lettuce (32 cents), and onions (43 cents). An additional 54 vegetable products cost between 50 and 99 cents per cup equivalent. These included romaine lettuce (51 cents), canned tomatoes (58 cents), canned corn (65 cents), and frozen broccoli (91 cents). In 2022, the most expensive vegetable product for U.S. consumers was frozen asparagus at $2.62 per cup equivalent.
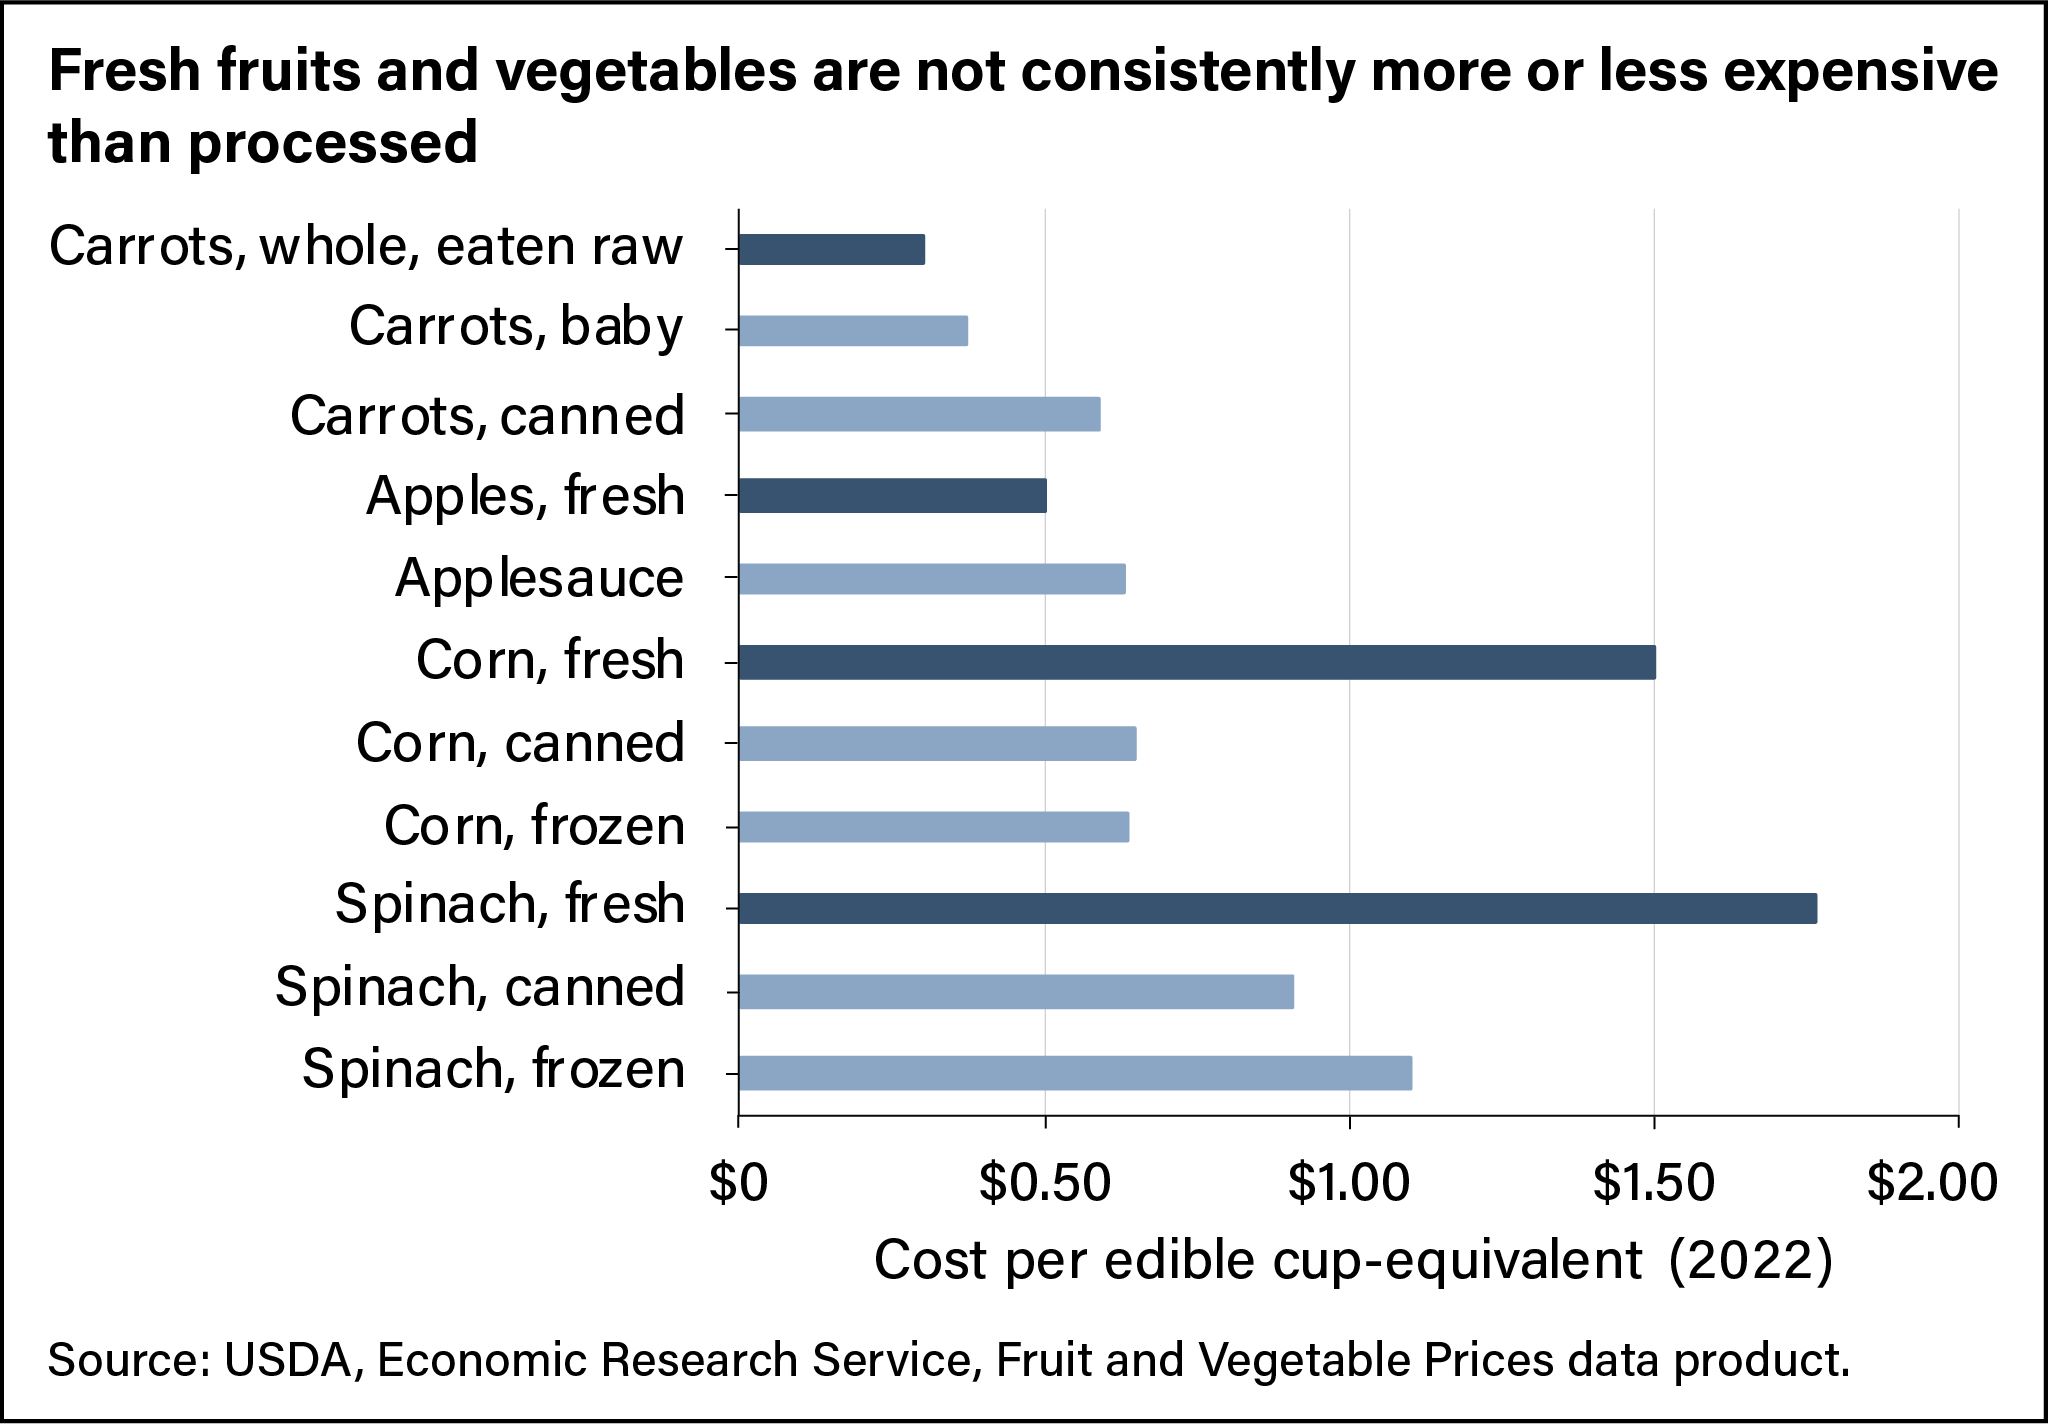
Fresh products are not necessarily more or less expensive than processed ones. If you are making a spinach and cheese quiche, it is more economical to buy spinach frozen ($1.10 per cup equivalent) or canned ($0.90 per cup equivalent) than fresh ($1.77 per cup equivalent). However, if you are making carrot soup, fresh carrots are the less expensive way to go at $0.38 per cup equivalent. Relative retail prices may reflect prices received by growers as well as differences in processing, handling, and spoilage costs, which can vary by form and product. Overall, neither fresh nor processed products turned out to be consistently less expensive.
Consumers’ Costs for Meeting Federal Fruit and Vegetable Recommendations
According to the Dietary Guidelines for Americans, fresh, canned, frozen, dried, and 100-percent juice count equally toward recommended intakes for fruits and vegetables. However, whole fruit should account for at least half of one’s total fruit consumption. Juice retains many of the same nutrients as fresh products but little dietary fiber. It is recommended that vegetable intake be spread across five subgroups: dark green vegetables, red and orange vegetables, starchy vegetables, other vegetables, and pulses such as beans, peas, and lentils.
Using estimates of each product’s cost per cup equivalent, ERS researchers generated combinations of fruits and vegetables that would satisfy recommendations for someone on a 2,000-calorie-per-day diet. Results show that, in 2022, it was possible to satisfy fruit and vegetable recommendations for about $2.50 to $3.00 per day.
| Cup equivalents | Cost | |
| Example combination 1 | ||
| Grapefruit juice, ready-to-drink | 1 | $0.60 |
| Apples, fresh | 1 | $0.50 |
| Tomato, large round, fresh | 1 | $0.90 |
| Potato, boiled from fresh | 1 | $0.27 |
| Pinto beans, canned | 0.5 | $0.33 |
| Total | 4.5 | $2.60 |
| Example combination 2 | ||
| Orange juice, ready-to-drink | 1 | $0.53 |
| Grapes | 1 | $0.70 |
| Romaine lettuce | 0.5 | $0.26 |
| Baby carrots | 0.5 | $0.19 |
| Green beans, frozen | 1 | $0.66 |
| Celery sticks | 0.5 | $0.33 |
| Total | 4.5 | $2.67 |
| Example combination 3 | ||
| Apples, fresh | 1 | $0.50 |
| Orange, fresh | 1 | $0.88 |
| Romaine lettuce | 0.5 | $0.26 |
| Carrots, whole, fresh | 0.5 | $0.15 |
| Tomato, large round, fresh | 0.5 | $0.45 |
| Green beans, frozen | 0.5 | $0.33 |
| Corn, canned | 0.5 | $0.32 |
| Total | 4.5 | $2.89 |
| Example combination 4 | ||
| Cantaloupe, fresh | 1 | $0.55 |
| Raisins | 1 | $0.66 |
| Broccoli florets, boiled from frozen | 0.5 | $0.45 |
| Peas and carrots, frozen | 0.5 | $0.32 |
| Sweet potato, boiled from fresh | 1 | $0.58 |
| Black beans, canned | 0.5 | $0.37 |
| Total | 4.5 | $2.93 |
| Note: Costs reflect prices in 2022. A cup equivalent is generally the edible portion of a fruit or vegetable that will fit in a 1-cup measuring cup; 2 cups for lettuce and other raw leafy greens; one-half cup for raisins and other dried fruit. Half-cup values may vary from 1-cup values in the text because of rounding. Source: USDA, Economic Research Service, Fruit and Vegetable Prices data product. |
||
This article is drawn from:
- Fruit and Vegetable Prices. (n.d.). U.S. Department of Agriculture, Economic Research Service.
You may also like:
- Stewart, H., Hyman, J., Carlson, A. & Frazão, E. (2016). The Cost of Satisfying Fruit and Vegetable Recommendations in the Dietary Guidelines. U.S. Department of Agriculture, Economic Research Service. EB-27.
- Young, S. K. & Stewart, H. (2022). U.S. fruit and vegetable availability on the Thrifty Food Plan depends on purchasing power and safety net supports. International Journal of Environmental Research and Public Health. 19 (5), 2772. https://doi.org/10.3390/ijerph19052772.
- Stewart, H., Hyman, J., Dong, D. & Carlson, A. (2021). The more that households prioritize healthy eating, the better they can afford to consume a sufficient quantity and variety of fruits and vegetables. Public Health Nutrition. 24 (7), 1841–1850. https://doi.org/10.1017/S1368980020004929.


