New Methods Can Help Predict Food Security Risk for Smaller Population Groups and at Substate Levels
- by Madeline Reed-Jones, Judith Bartfeld and Clio Polanco Cercado
- 9/19/2024
The percent of U.S. households with access at all times to enough food for an active, healthy life for all household members is called the food security prevalence rate. It has been reported annually by the USDA, Economic Research Service (ERS) since 1995 using data from the Current Population Survey Food Security Supplement (CPS-FSS). By averaging 3 years of data, ERS researchers are able to estimate State-level food security rates. However, examining food security within States at a smaller geographic level using the CPS-FSS alone is constrained by limited sample sizes and incomplete information about within-State locations. Yet, substate food security estimates can be useful to highlight unique challenges in an area or illustrate that State-level concerns are equally relevant at a more local level.
Researchers from the University of Wisconsin-Madison and ERS recently adapted a statistical methodology to provide new insights into food security disparities among demographic groups within States, as well as variation in food security across substate geographies. Whereas food security estimates that ERS reports annually are based on survey responses to food security questions in the CPS-FSS, estimates from this new approach are based on a model that predicts whether a household is food insecure using detailed information on household characteristics.
The approach relied on an established statistical method called Cross Survey Multiple Imputation. In this approach, two data sets representing the same population are used: a smaller “donor data set,” that contains a key variable of interest, and a larger “recipient data set” that lacks the key variable. The CPS-FSS is the donor data set. It includes the variable of interest—food security—but has too small a sample to generate sufficiently precise estimates of food insecurity among subgroups within states. The American Community Survey (ACS) is the recipient data set; it has a much larger sample but does not contain food security information. Both data sets are drawn from the same population and contain information on household income, age, race, household composition, and other characteristics that are known to predict food security. Researchers used the variables in the CPS-FSS to model food security and then applied the estimated parameters from that model to households in the ACS. This method allows researchers to impute, or assign, multiple estimates of food security status for every household in the ACS.
With household food security status ascribed to each household, researchers then aggregated households in the ACS to estimate the food insecurity rate among subgroups of interest. They also calculated the standard errors, a measure of statistical uncertainty, of these estimates.
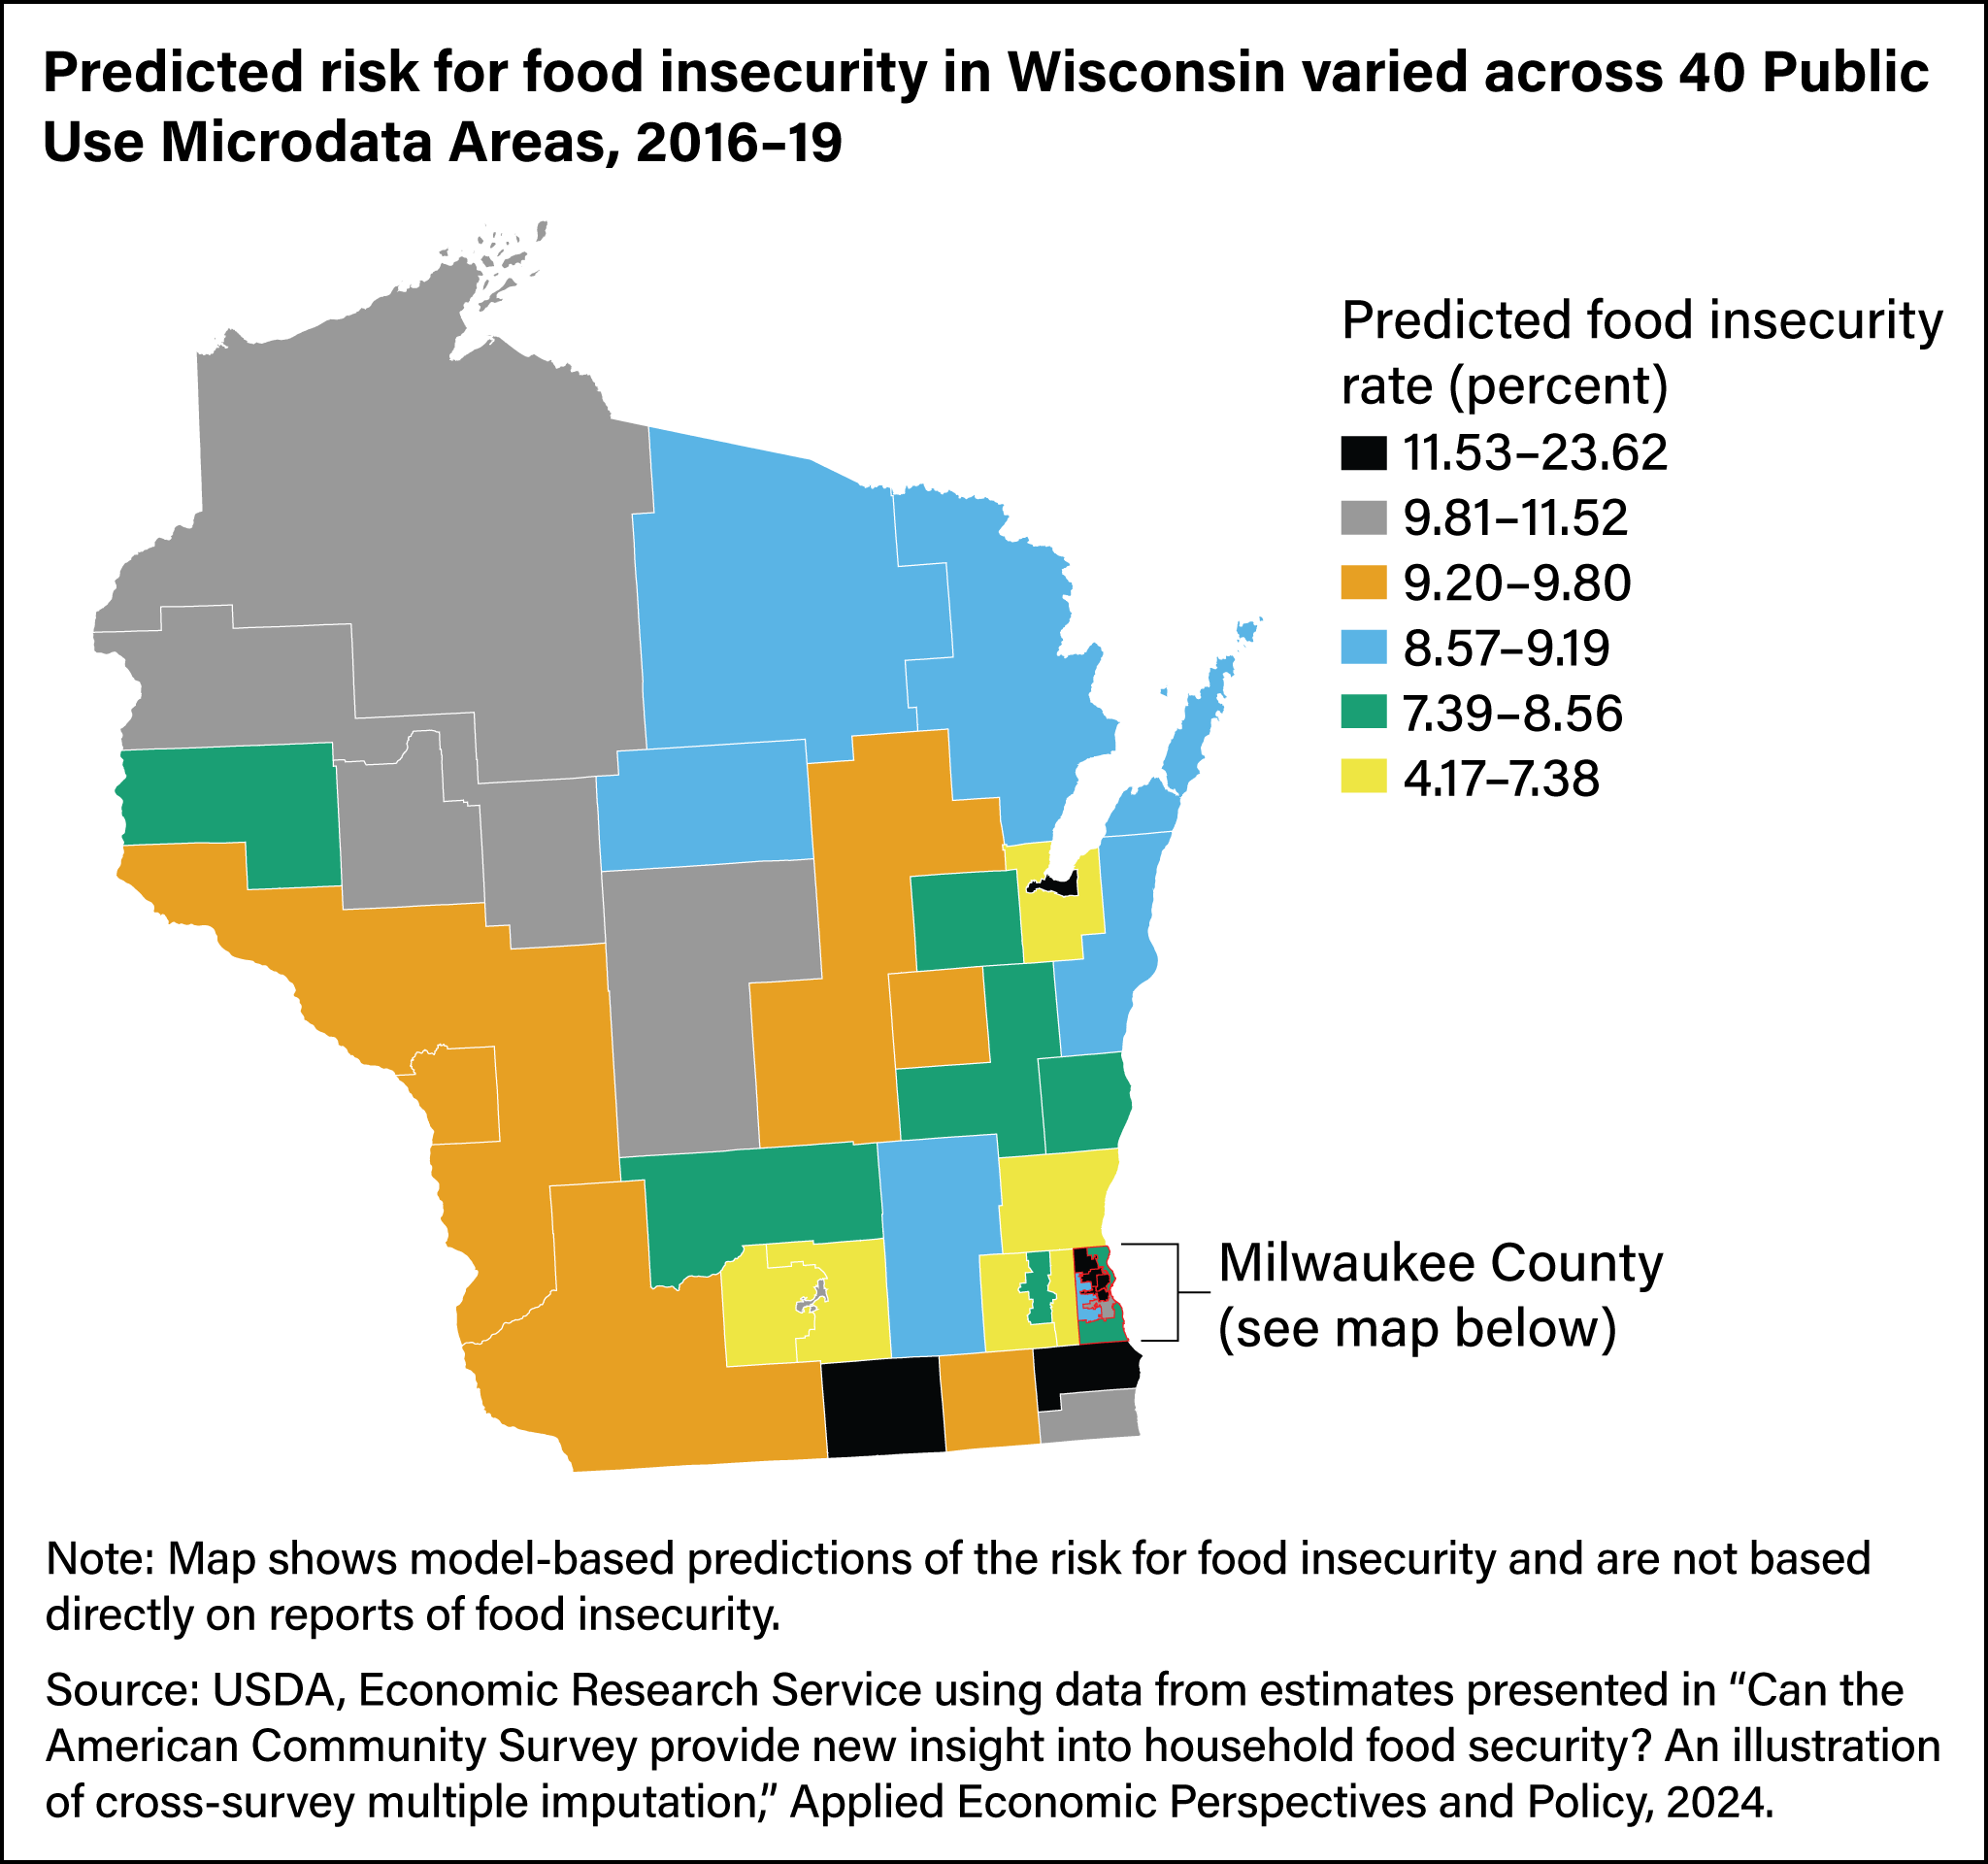
The researchers provided two kinds of examples of how this approach can be used to provide new insight into food security. First, they estimated how food insecurity varied by race and ethnicity within States and showed that these estimates were more precise (that is, they had smaller standard errors) than estimates from the CPS-FSS. Second, they showed how this approach can provide estimates of geographic variation within States, by aggregating households that live in the same substate area. These kinds of estimates cannot be systematically generated from the CPS-FSS itself, because substate geographic identifiers are not available for many of the households in that data set. Using Wisconsin as an example, they showed predicted risk for food security for every Public Use Microdata Area (PUMA) in the State. Each PUMA represents an area of at least 100,000 people.
The map above shows predicted risk for food insecurity in Wisconsin according to Public Use Microdata Area. Because PUMAs are based on population, they variously represent subcounty, single-county, or multicounty areas. Across PUMAs in Wisconsin, the predicted risk for food insecurity ranged from 4.17 percent of households to 23.62 percent of households. Milwaukee County, shown in the map below, is a densely populated area of the State with eight PUMAs and a predicted risk for food insecurity ranging from 7.99 percent to 23.62 percent. The PUMA-level estimates are measured with less precision than the race and ethnicity subgroups because of small samples sizes in each PUMA.
The approach used in this research relied on a variety of statistical assumptions. The researchers compared their findings to other relevant benchmarks and found their estimates aligned fairly well. Overall, this research demonstrates that predicted food insecurity can provide insight into disparities within States by race and ethnicity, as well as variation in food security across substate geographies. The approach can also be used to look at other subgroups, making this a flexible tool that can generate estimates useful for understanding how food insecurity risk varies within States by geography, demographic characteristics, or other attributes.
This article is drawn from:
- Bartfeld, J. & Reed-Jones, M. (2024). Can the American Community Survey provide new insight into household food security? An illustration of cross-survey multiple imputation. Applied Economic Perspectives and Policy. doi.org/10.1002/aepp.13441.
You may also like:
- Food Security in the U.S.. (n.d.). U.S. Department of Agriculture, Economic Research Service.
- Bartfeld, J., Dunifon, R., Nord, M. & Carlson, S. (2006). What Factors Account for State-to-State Differences in Food Security?. USDA, Economic Research Service.


