
Understanding Farm Diversity: Insights From the Agricultural Resource Management Survey
- by Katherine Lacy and Nigel Key
- 5/30/2024
Highlights
- Higher shares of socially disadvantaged producers are located in the Plains and Western regions. There also are higher proportions specializing in cattle production and specialty crops.
- A greater share of non-Hispanic Black farms was at financial risk than Non-Hispanic White farms, according to data on operating profit margins.
- Farms with a socially disadvantaged producer differ from non-Hispanic White farms in a number of other ways, including age, experience, education and proportion and amount of Government payments received.
- Hispanic and Non-Hispanic socially disadvantaged farms were less likely to receive farm payments than Non-Hispanic White farms.
Data available from the Agricultural Resource Management Survey (ARMS)—an annual survey of farmers jointly produced by USDA, Economic Research Service (ERS) and USDA, National Agricultural Statistics Service (NASS)—is used to evaluate the diversity of U.S. farms. ERS researchers recently used ARMS data to compare groups of farms based on the racial and ethnic characteristics of the farm operators. In 2022, the ARMS included a targeted sample of farms and ranches operated by socially disadvantaged producers, defined as those belonging to groups that historically have faced racial or ethnic prejudice. Targeting this group ensured researchers had a large enough sample to generate statistics across different race and ethnicity groups.
Farm Demographics
The ARMS collects race and ethnicity information for up to four operators on a farm operation. Using this information, ERS researchers classified farm operations into three mutually exclusive categories:
- non-Hispanic White: farms with only non-Hispanic White producers,
- Hispanic: farms with at least one Hispanic producer of any race, or
- non-Hispanic socially disadvantaged: farms with at least one non-Hispanic socially disadvantaged producer and no Hispanic producers. The non-Hispanic socially disadvantaged category is defined as operators who identify on the survey as Black or African American, Asian, American Indian or Alaska Native, or Native Hawaiian or Other Pacific Islander.
Research using the targeted 2022 ARMS sample breaks the non-Hispanic socially disadvantaged category into three mutually exclusive categories based on operator race:
- non-Hispanic Black or African American,
- non-Hispanic Asian, or
- non-Hispanic American Indian or Alaska Native.
Non-Hispanic socially disadvantaged farms with multiple operators of different races, individual operators who selected more than one race, or any Native Hawaiian or Pacific Islander operators were excluded from the analysis because there were not enough of these farms to provide reliable statistics. Hispanic is an ethnic identification rather than a race, so producers who identify as Hispanic ethnicity can be of any race. Of the approximately 2 million U.S. farms in 2022, 91 percent were non-Hispanic White, 4 percent were Hispanic, 2 percent were non-Hispanic American Indian or Alaska Native, 1 percent were non-Hispanic Black or African American, and 1 percent were non-Hispanic Asian farms.
The prevalence of farms operated by socially disadvantaged producers (Hispanic and non-Hispanic) varied across U.S. regions, according to ARMS data from 2017 to 2020. The Plains and the West had the largest shares of socially disadvantaged producers as a whole, while the Midwest had the lowest share of farms operated by such producers. States with the highest share of socially disadvantaged farms included California (19 percent), Texas (18 percent), and Florida (16 percent). Hispanic farms were most prevalent in the Plains and the West, and the West had the greatest share of non-Hispanic socially disadvantaged producers.

ERS defines farms as residence, intermediate, and commercial based on farm ownership (family versus nonfamily), principal operator occupation, and gross cash farm income (GCFI). Residence and intermediate farms are family farms with less than $350,000 GCFI. Residence farms have a principal operator who is retired from farming or has a primary occupation other than farming. Intermediate farms have a principal operator whose primary occupation is farming. Commercial farms are family farms with GCFI of $350,000 or more and nonfamily farms of any size. Compared with non-Hispanic White farm operations, a smaller percentage of non-Hispanic Black or African American farm operations in 2022 were residence and commercial farms, and a larger percentage were intermediate farms. ERS researchers also found that 2 percent of non-Hispanic American Indian or Alaska Native farm operations were classified as commercial farms, compared with 12 percent of non-Hispanic White farm operations.

Farm Specialization
Next, researchers evaluated the distribution of farm specialization among different race and ethnicity groups. They grouped agricultural products into five categories: cash grains (such as corn and wheat) and soybeans; other field crops; specialty crops, which include fresh or dried fruits, tree nuts, vegetables, beans (pulses), and horticulture nursery crops; cattle; and all other livestock.
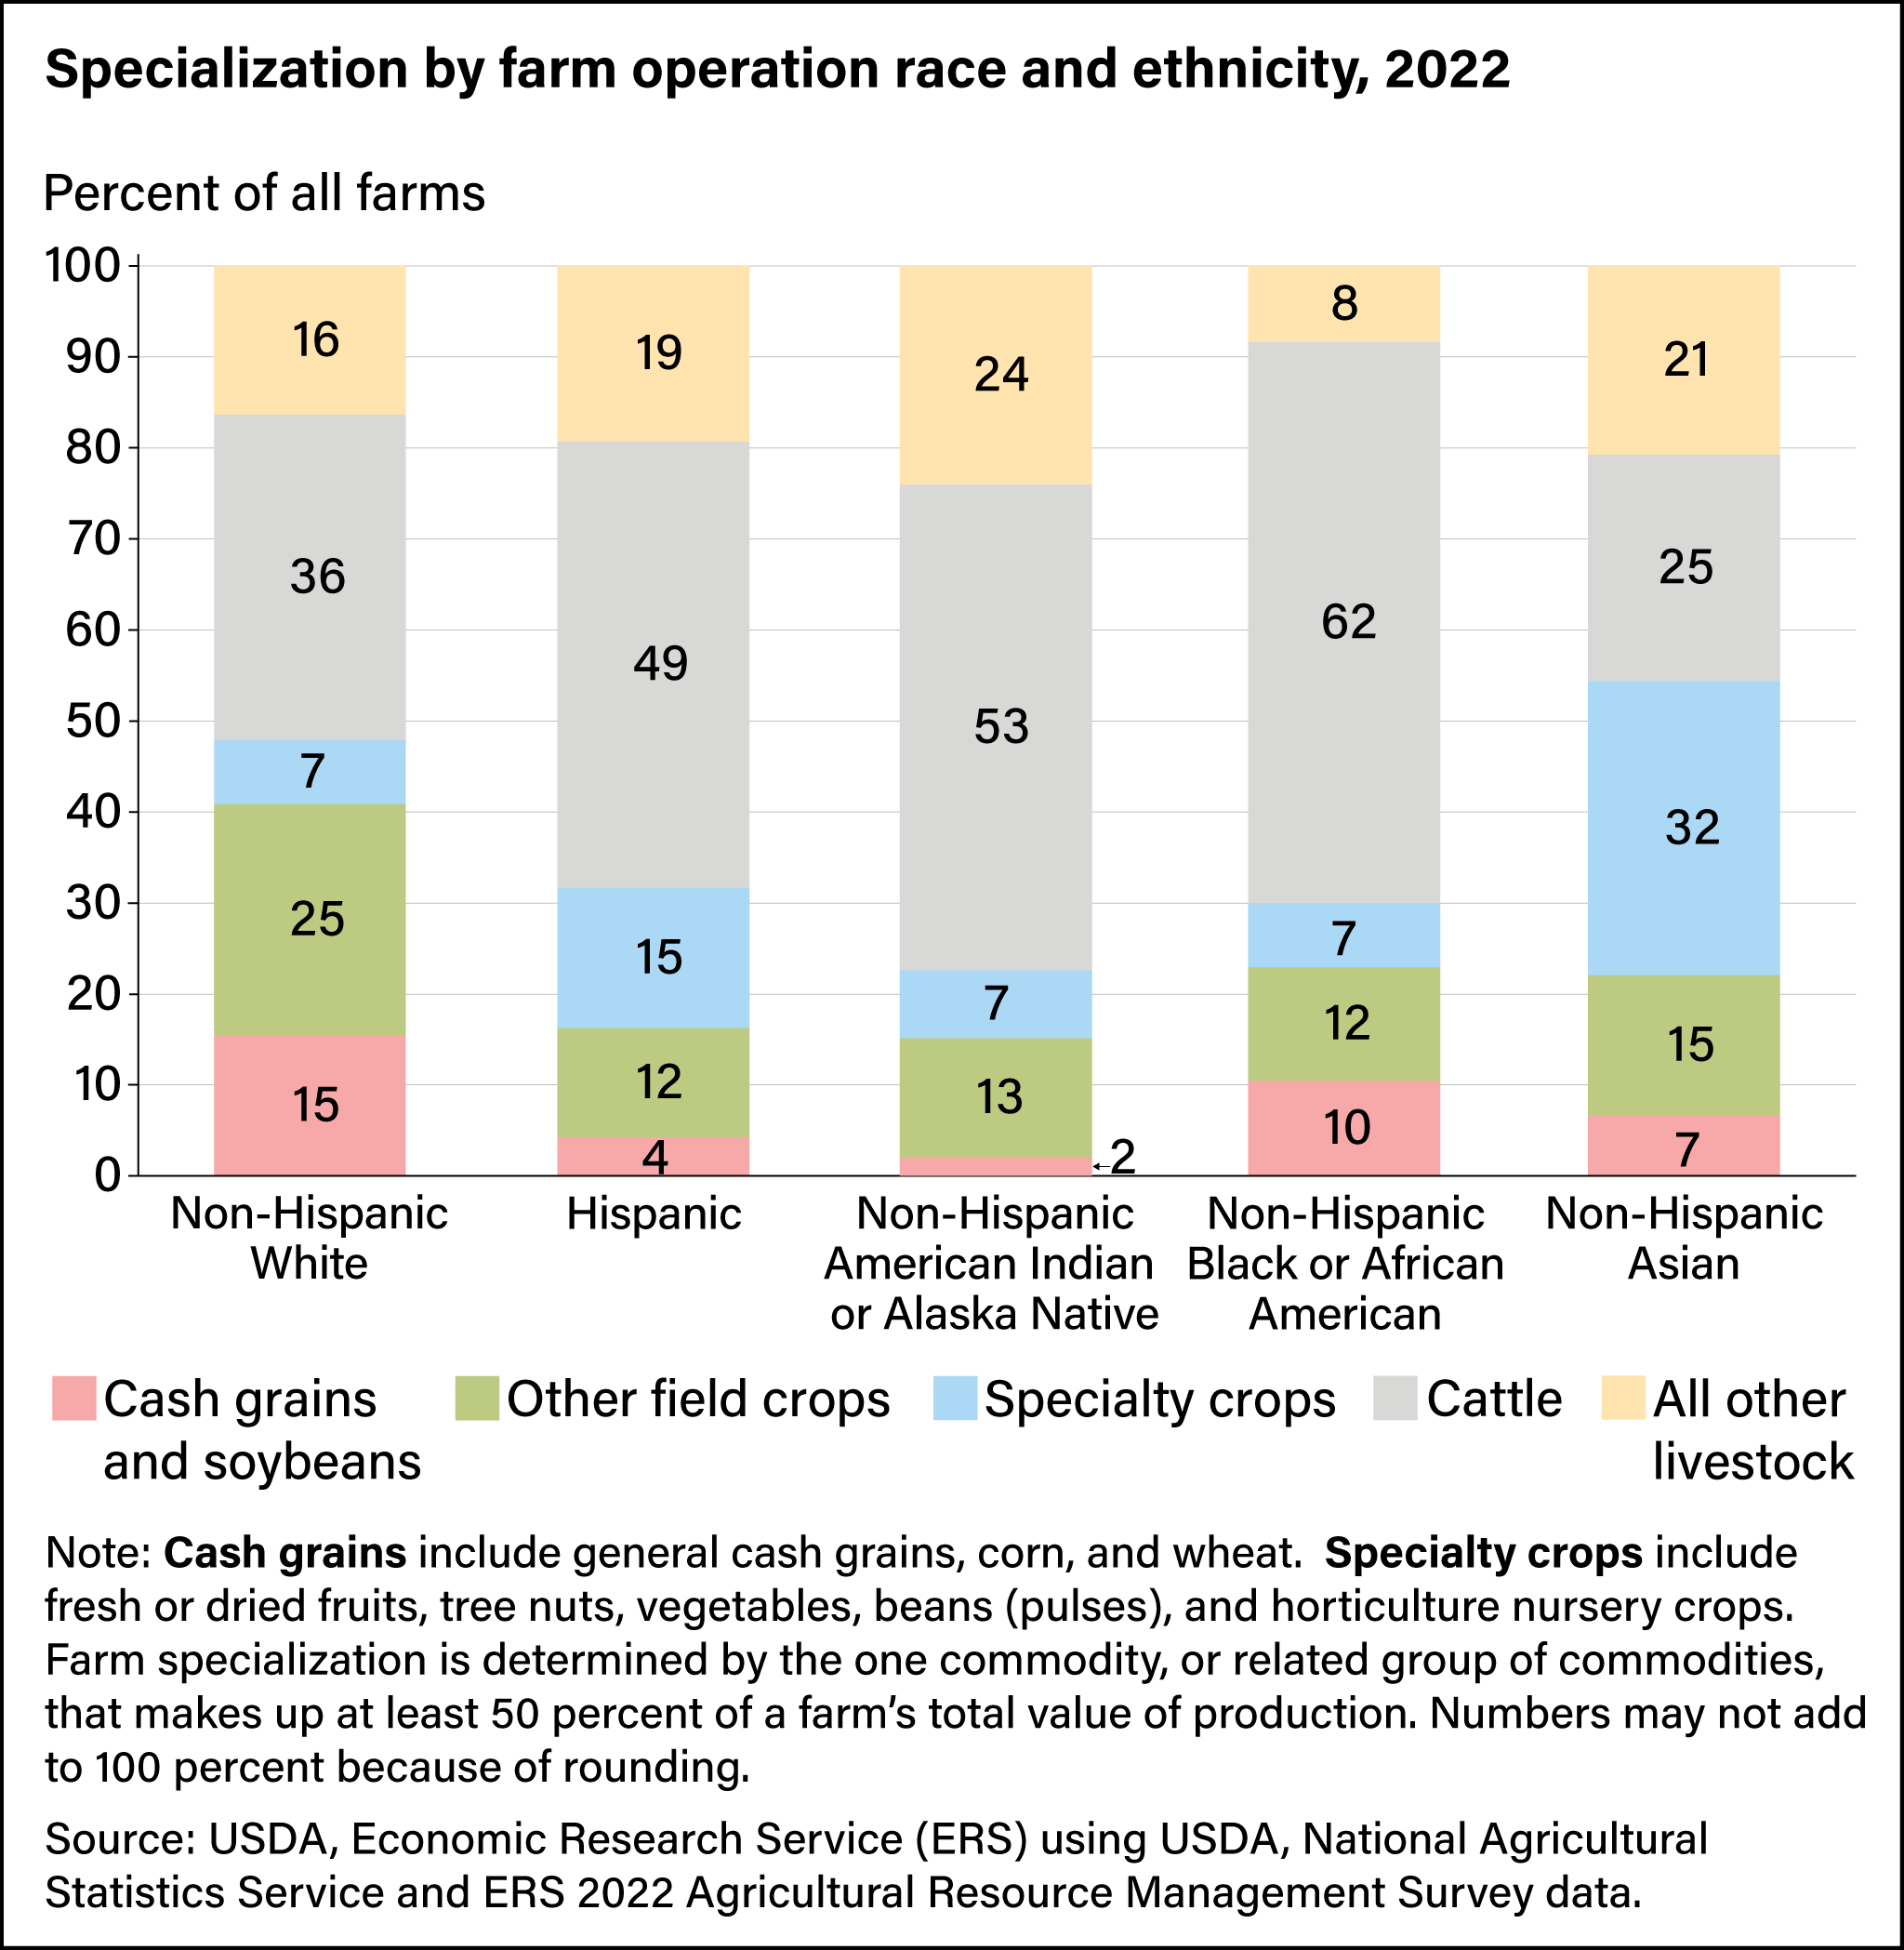
Socially disadvantaged farms are less likely to specialize in cash grains and soybeans and other field crops than non-Hispanic White farms. In 2022, about one-fifth (22 percent) or less of socially disadvantaged farms specialized in cash grains and soybeans, or other field crops, compared with 40 percent of non-Hispanic White farms. On the other hand, 15 percent of Hispanic operations and 32 percent of non-Hispanic Asian operations specialized in specialty crops, surpassing the 7 percent average of farms operated by all other race and ethnicity groups. Additionally, the share of farm operations concentrated in cattle and other livestock production was 68 percent for Hispanic farms, 77 percent for non-Hispanic American Indian farms, and 70 percent for non-Hispanic Black farms, all exceeding 52 percent for non-Hispanic White farms.
Government Payments
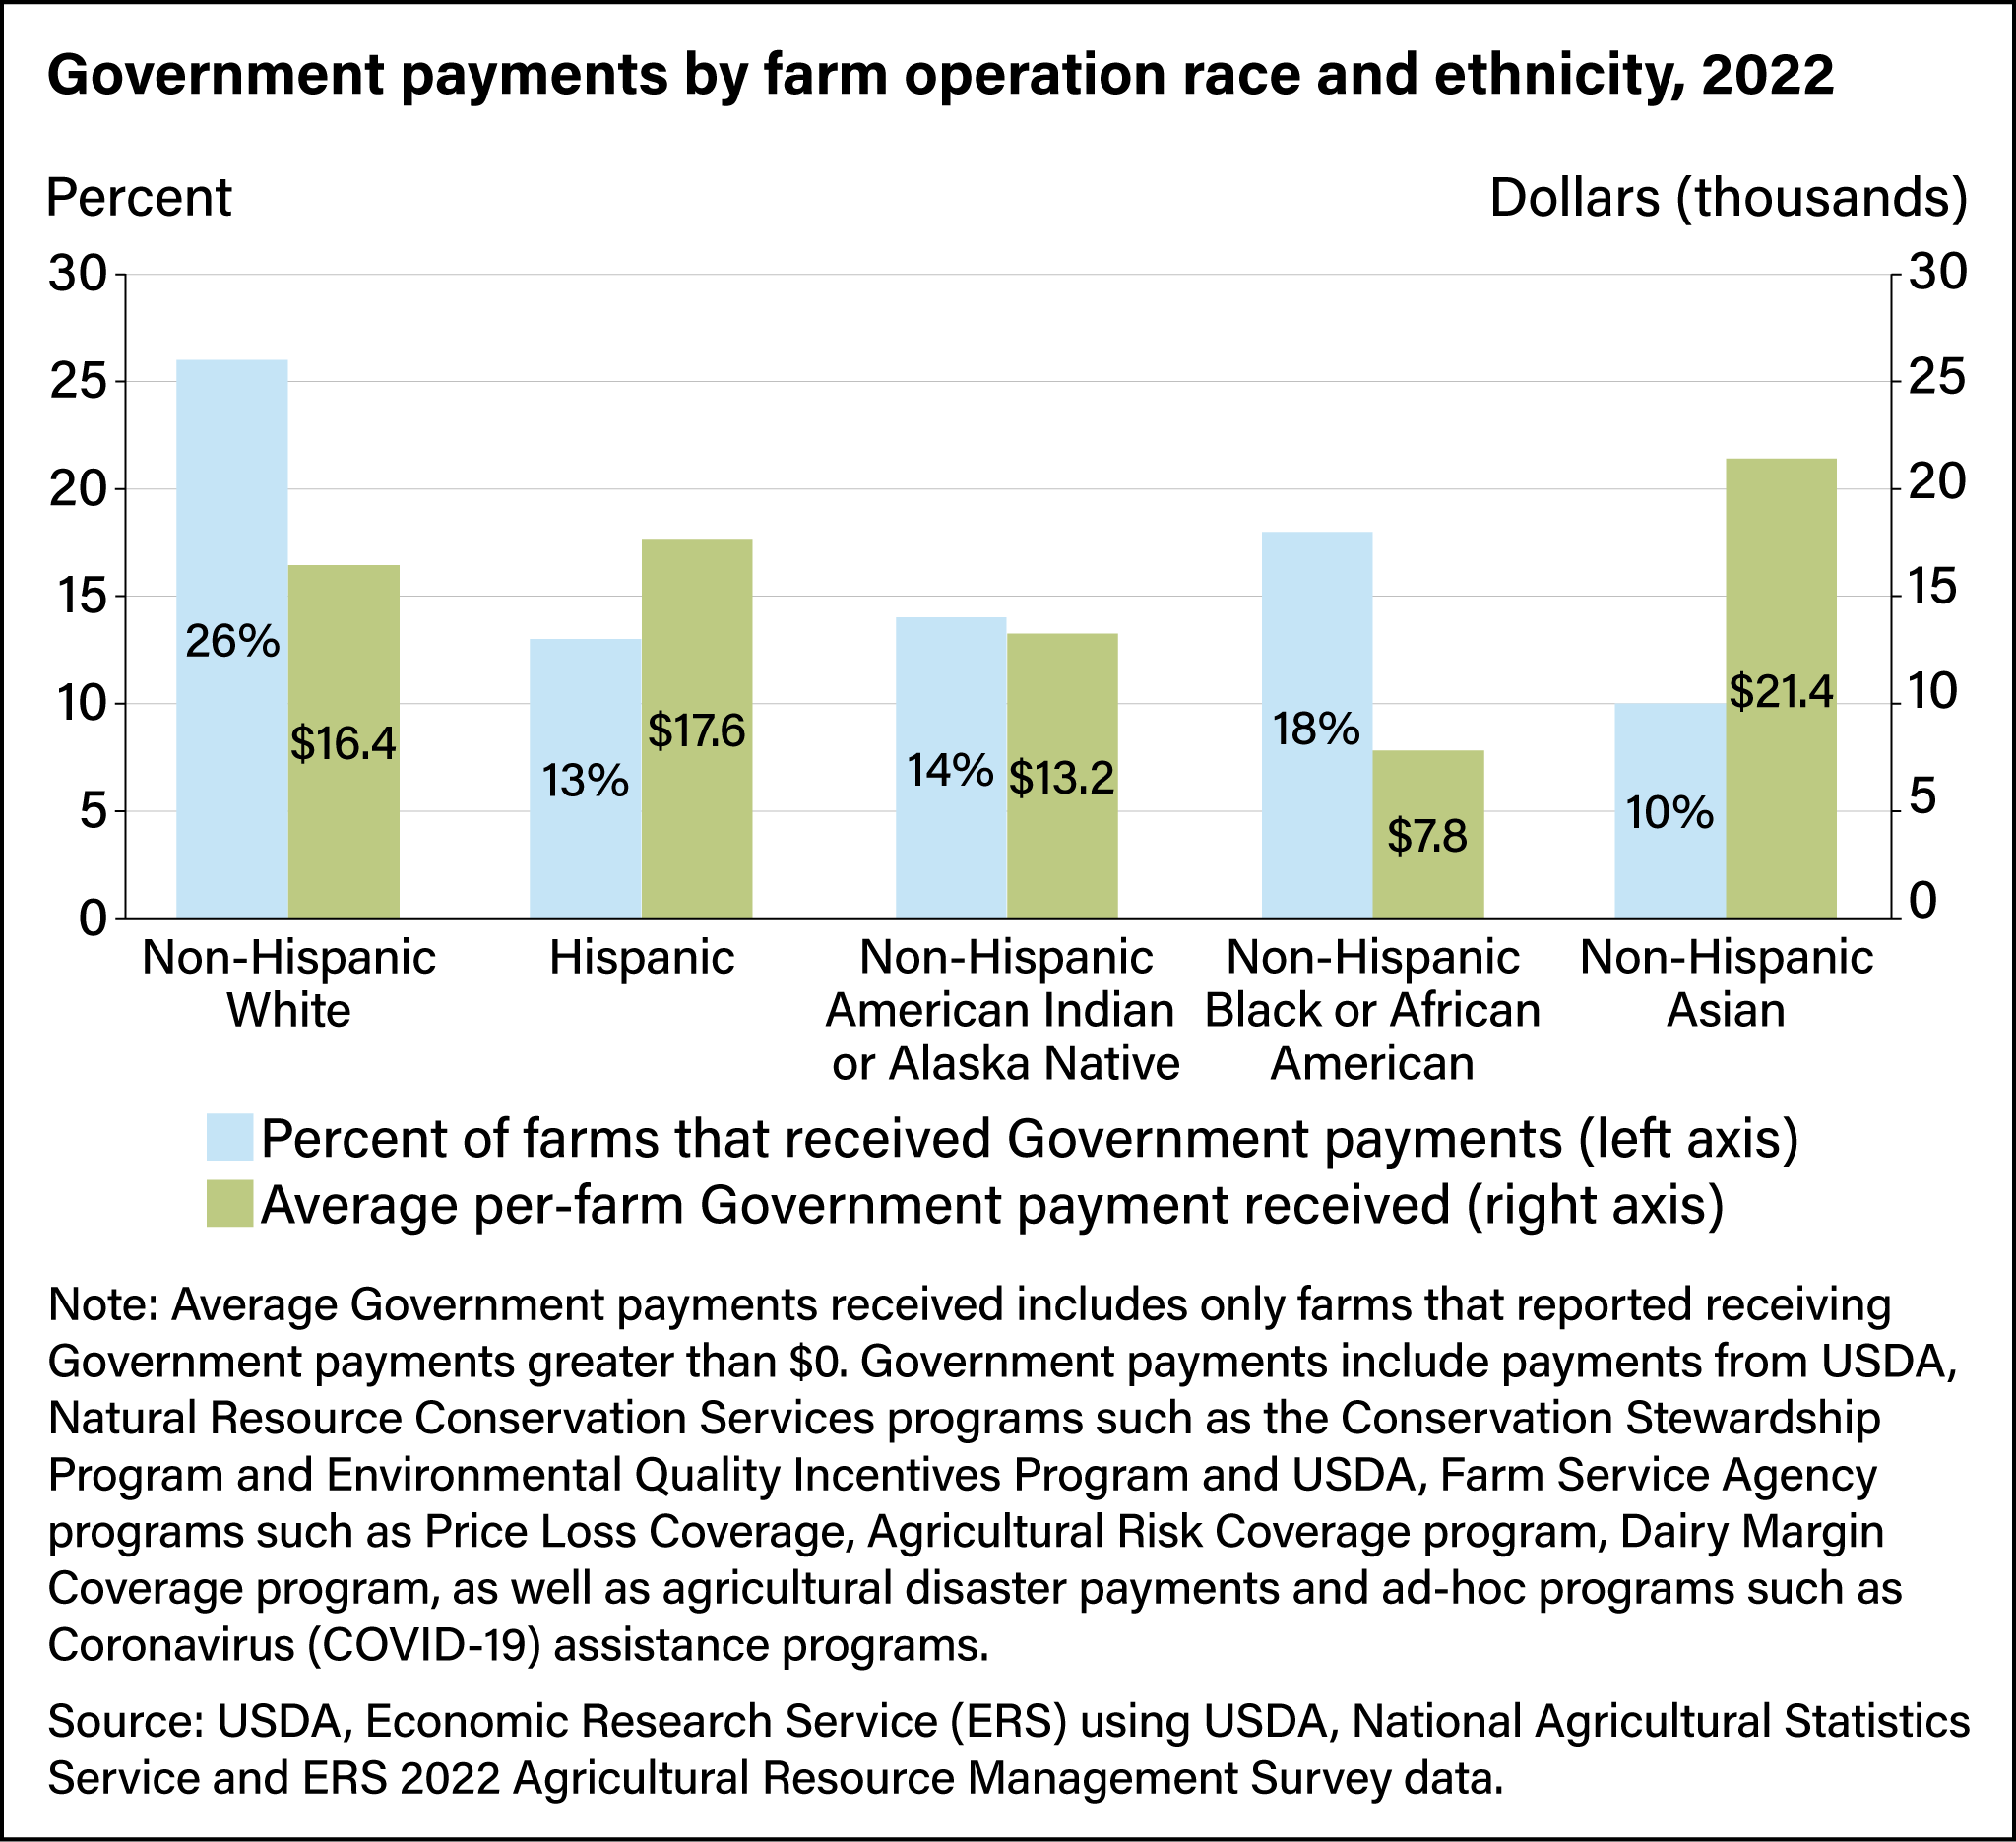
The differences in the distribution of farm specialization hold potential implications for participation in Government programs and average payments received. Of all Government payments distributed in 2022, 44 percent were allocated to operators of farms specializing in cash grains and soybeans, 24 percent to cattle farms, and 15 percent to farms specializing in other field crops. As seen in the next chart, 10 to 18 percent of socially disadvantaged farm operations received Government payments, less than 26 percent for non-Hispanic White-operated farms.
The national average payment in 2022 was $16,308, with 25 percent of all operations participating in Government programs. Non-Hispanic Black or African American farms and ranches that received Government payments received an average payment of $7,774, compared with $16,417 for non-Hispanic White operations. Differences in farm size and commodity specialization could account in part for the lower average payments for non-Hispanic Black or African American operations. For instance, 3 percent of non-Hispanic Black farms were classified as commercial farms in 2022, compared with 12 percent of non-Hispanic White farms. Additionally, non-Hispanic White farms are more likely to specialize in cash grains and soybeans and other field crops, which are the focus of some Government programs. Also in 2022, Government payments went to 13 percent of Hispanic-operated farms (with $17,637 in average payments), 14 percent of non-Hispanic American Indian or Alaska Native operations ($13,228), and 10 percent of non-Hispanic Asian operations ($21,394).
Financial Risk and Vulnerability
A measure of financial vulnerability or financial risk is the operating profit margin (OPM), which is the share of gross income that is profit. Operating profit is calculated as net farm income plus interest paid minus an adjustment for any unpaid labor. OPM is a benchmark for an operation’s financial health and is used to denote if a farm is considered high-risk, medium-risk, or low-risk. If the operating profit margin is below 10 percent, the operation is in high financial risk; an OPM of 10 to 25 percent suggests medium financial risk; and OPM above 25 percent means low financial risk. The OPM cannot be calculated for farms with zero or negative gross farm income, which could occur when operations have a large decrease in their value of inventory.
As seen in the chart below, the majority of farms operate in the high-risk zone, with 64 to 74 percent of farms of all race categories having an operating profit margin in the high-risk zone in 2022, compared with 8 to 26 percent of farms in the low-risk zone. Notably, only 8 percent of non-Hispanic Black farm operations are in the low-risk zone, making that group more likely to face financial risk than all other race and ethnicity groups.

Operator Characteristics
The ARMS also provides insight into how the characteristics of farm operators vary across different groups in terms of education, experience, occupation, and gender. Compared with non-Hispanic White farms, the average age of operators on Hispanic farms was lower (57 versus 60 years), and Hispanic operators were less likely to be retired from farming (10 versus 15 percent). Hispanic operations also were more likely than non-Hispanic White farms to have a producer with 10 years or fewer of farming experience (the definition of a beginning farmer). Regarding education, a smaller share of the principal operators on Hispanic and non-Hispanic socially disadvantaged farms had a high school diploma compared with non-Hispanic White operations. There also were differences in off-farm employment. Hispanic farms were more likely than non-Hispanic White farms to have operators report that farming was not their primary occupation (68 versus 61 percent). Finally, farms with non-Hispanic socially disadvantaged operators were more likely to have a woman operator (57 percent) than Non-Hispanic White farms (53 percent).
| Non-Hispanic White farms | Hispanic farms | Non-Hispanic socially disadvantaged farms | ||
| Mean age of operators (years) | 60 | 57 | 59 | |
| Any operator retired from farming (percent) | 15 | 10 | 15 | |
| Any operator with 10 years or less farming experience (percent) | 20 | 27 | 19 | |
| Principal operator with at least a high school diploma (percent) | 95 | 85 | 89 | |
| Any operator with nonfarm primary occupation (percent) | 61 | 68 | 63 | |
| Farm has a woman operator (percent) | 53 | 50 | 57 | |
| Source: USDA, Economic Research Service (ERS) using data from ERS and USDA, National Agricultural Statistics Service 2017–20 Agricultural Resource Management Survey. | ||||
This article is drawn from:
- Whitt, C., Lacy, K. & Lim, K. (2023). America’s Farms and Ranches at a Glance: 2023 Edition. U.S. Department of Agriculture, Economic Research Service. EIB-263.
- Todd, J.E., Whitt, C., Key, N. & Mandalay, O. (2024). An Overview of Farms Operated by Socially Disadvantaged, Women, and Limited Resource Farmers and Ranchers in the United States. U.S. Department of Agriculture, Economic Research Service. EIB-266.
You may also like:
- ARMS Farm Financial and Crop Production Practices. (n.d.). U.S. Department of Agriculture, Economic Research Service.