
Patterns of Global Food Consumption Expected to Shift in Next Quarter Century as Population, Incomes Rise
- by Ron Sands
- 6/20/2024
Highlights
- Rising incomes historically have implied increasing per capita consumption of total food calories as well as calories from animal products.
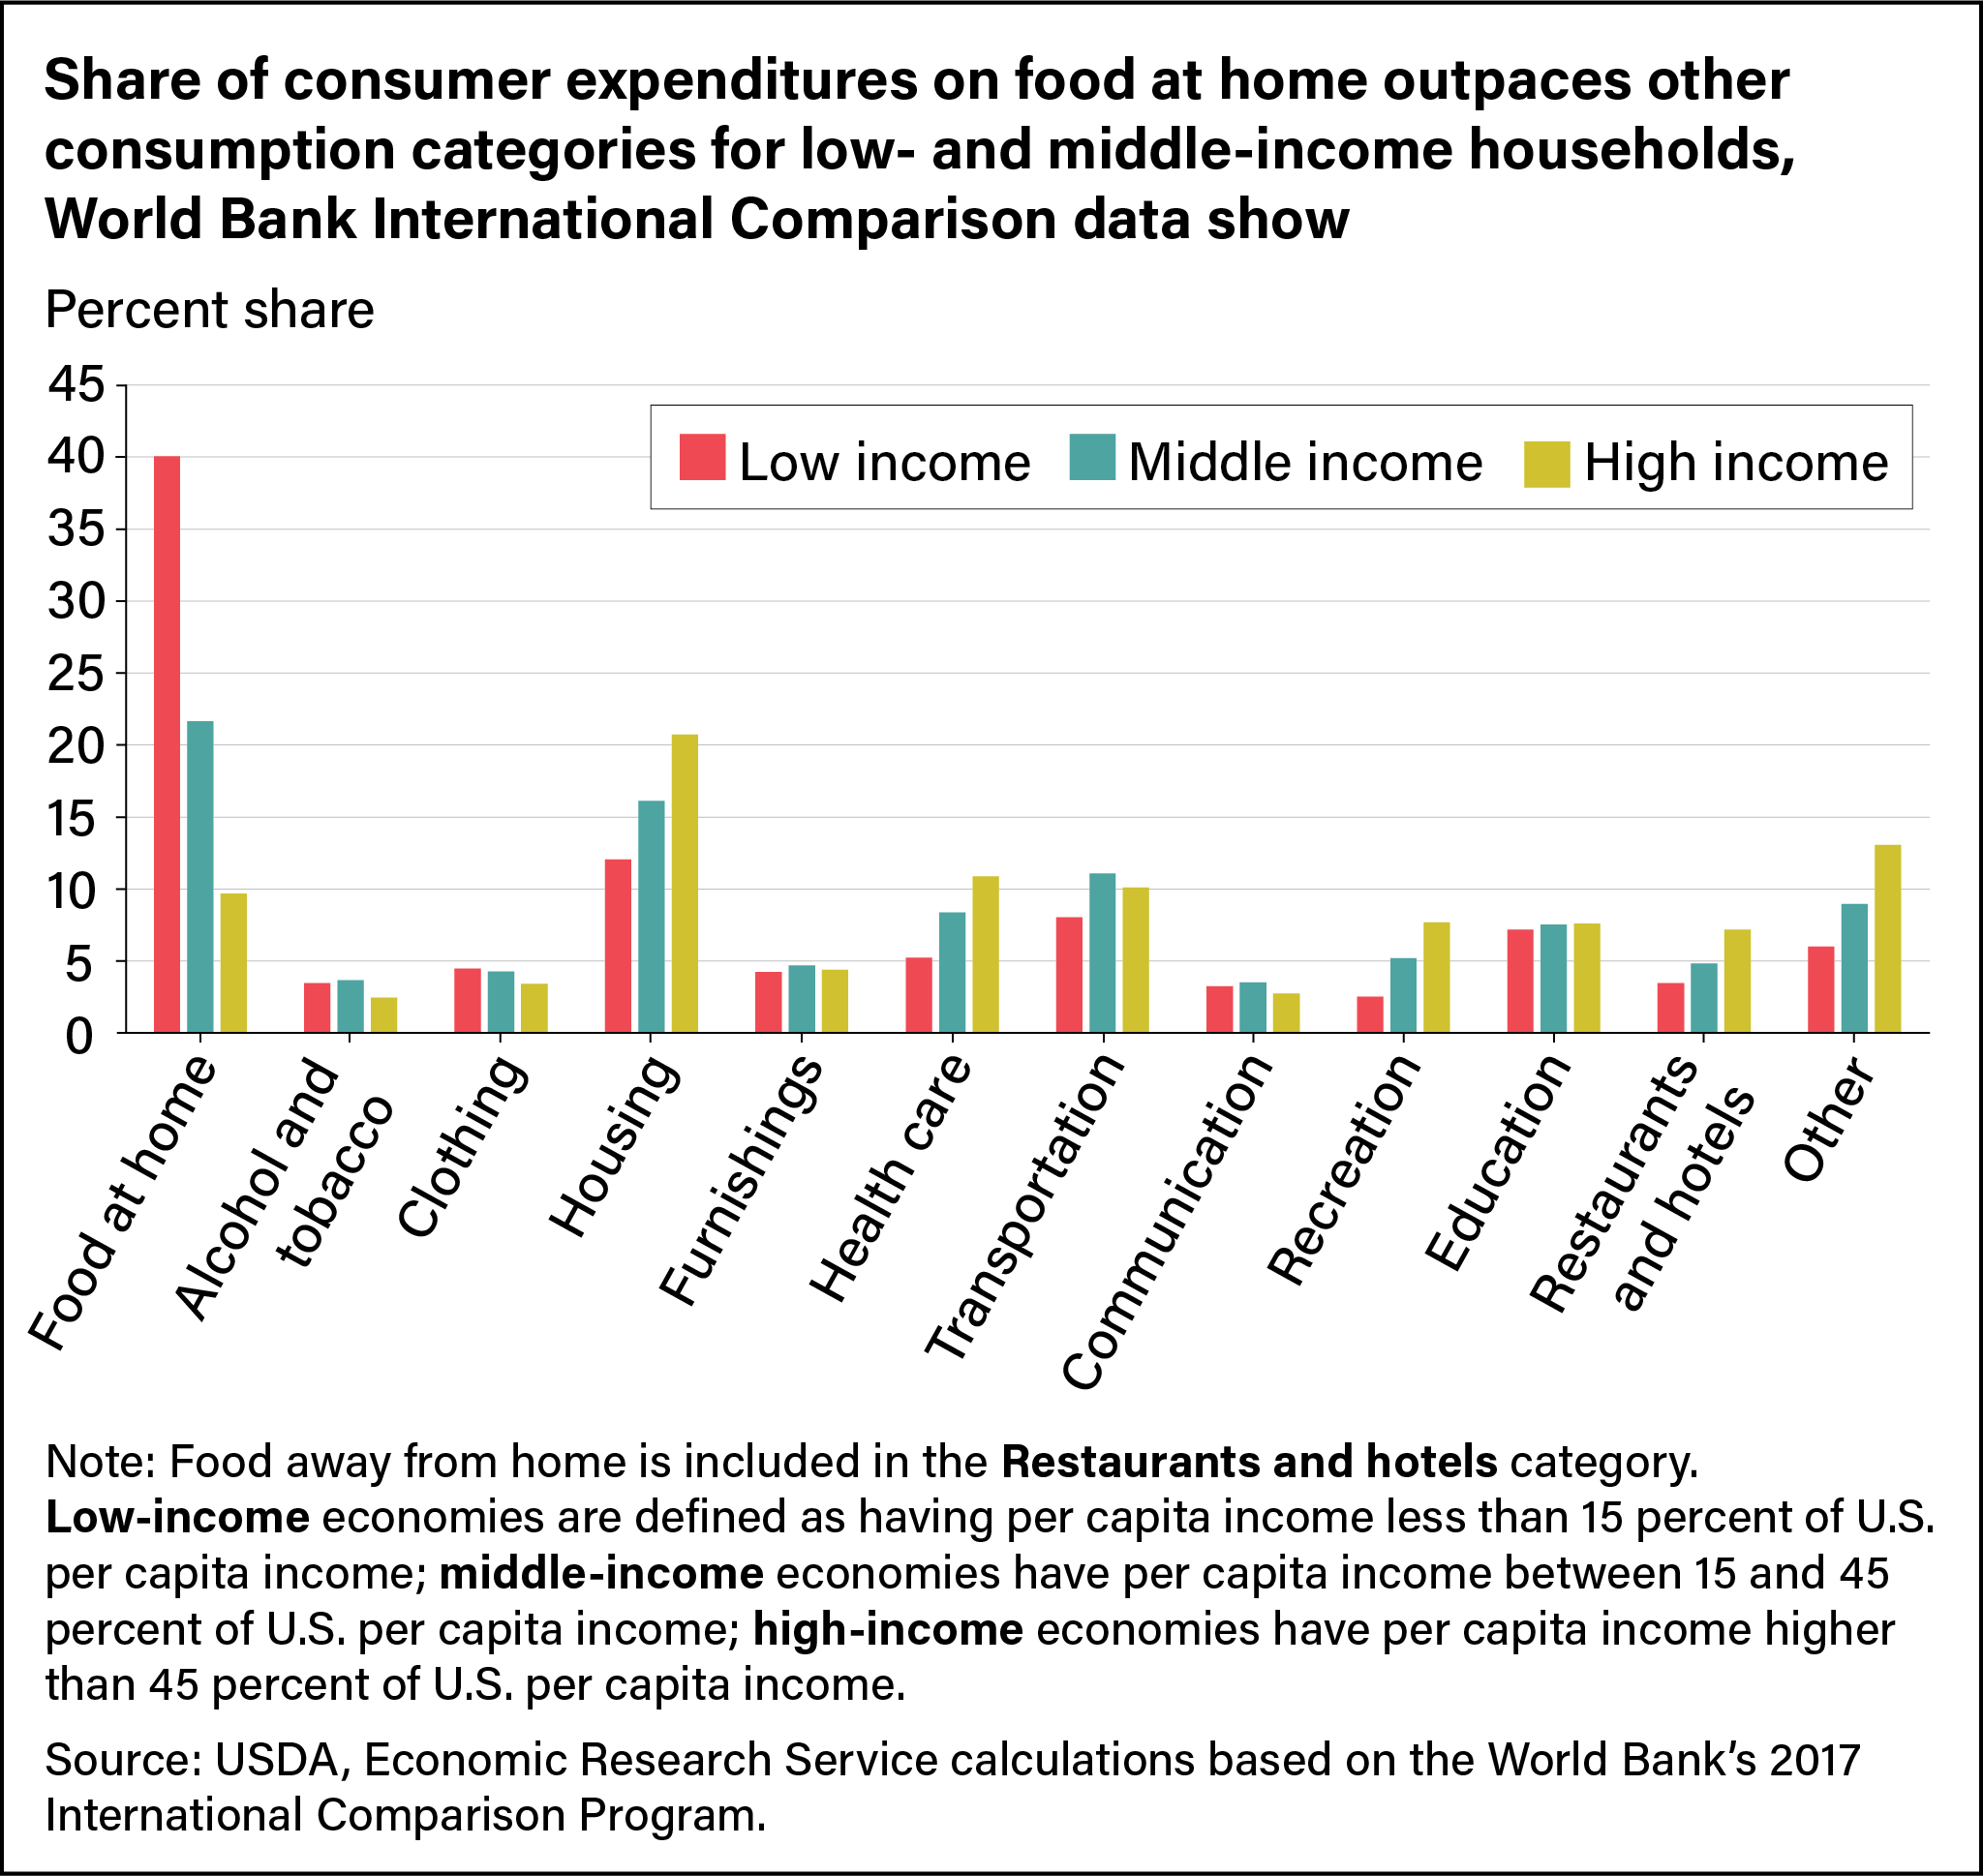
- Spending on food at home globally has an average expenditure share of 40 percent in low-income economies and 22 percent in middle-income economies.
- Taking into account income-driven diets and global population growth of 39 percent, available food calories are projected to grow 44 percent from 2011 to 2050, and crop calories would increase 47 percent.
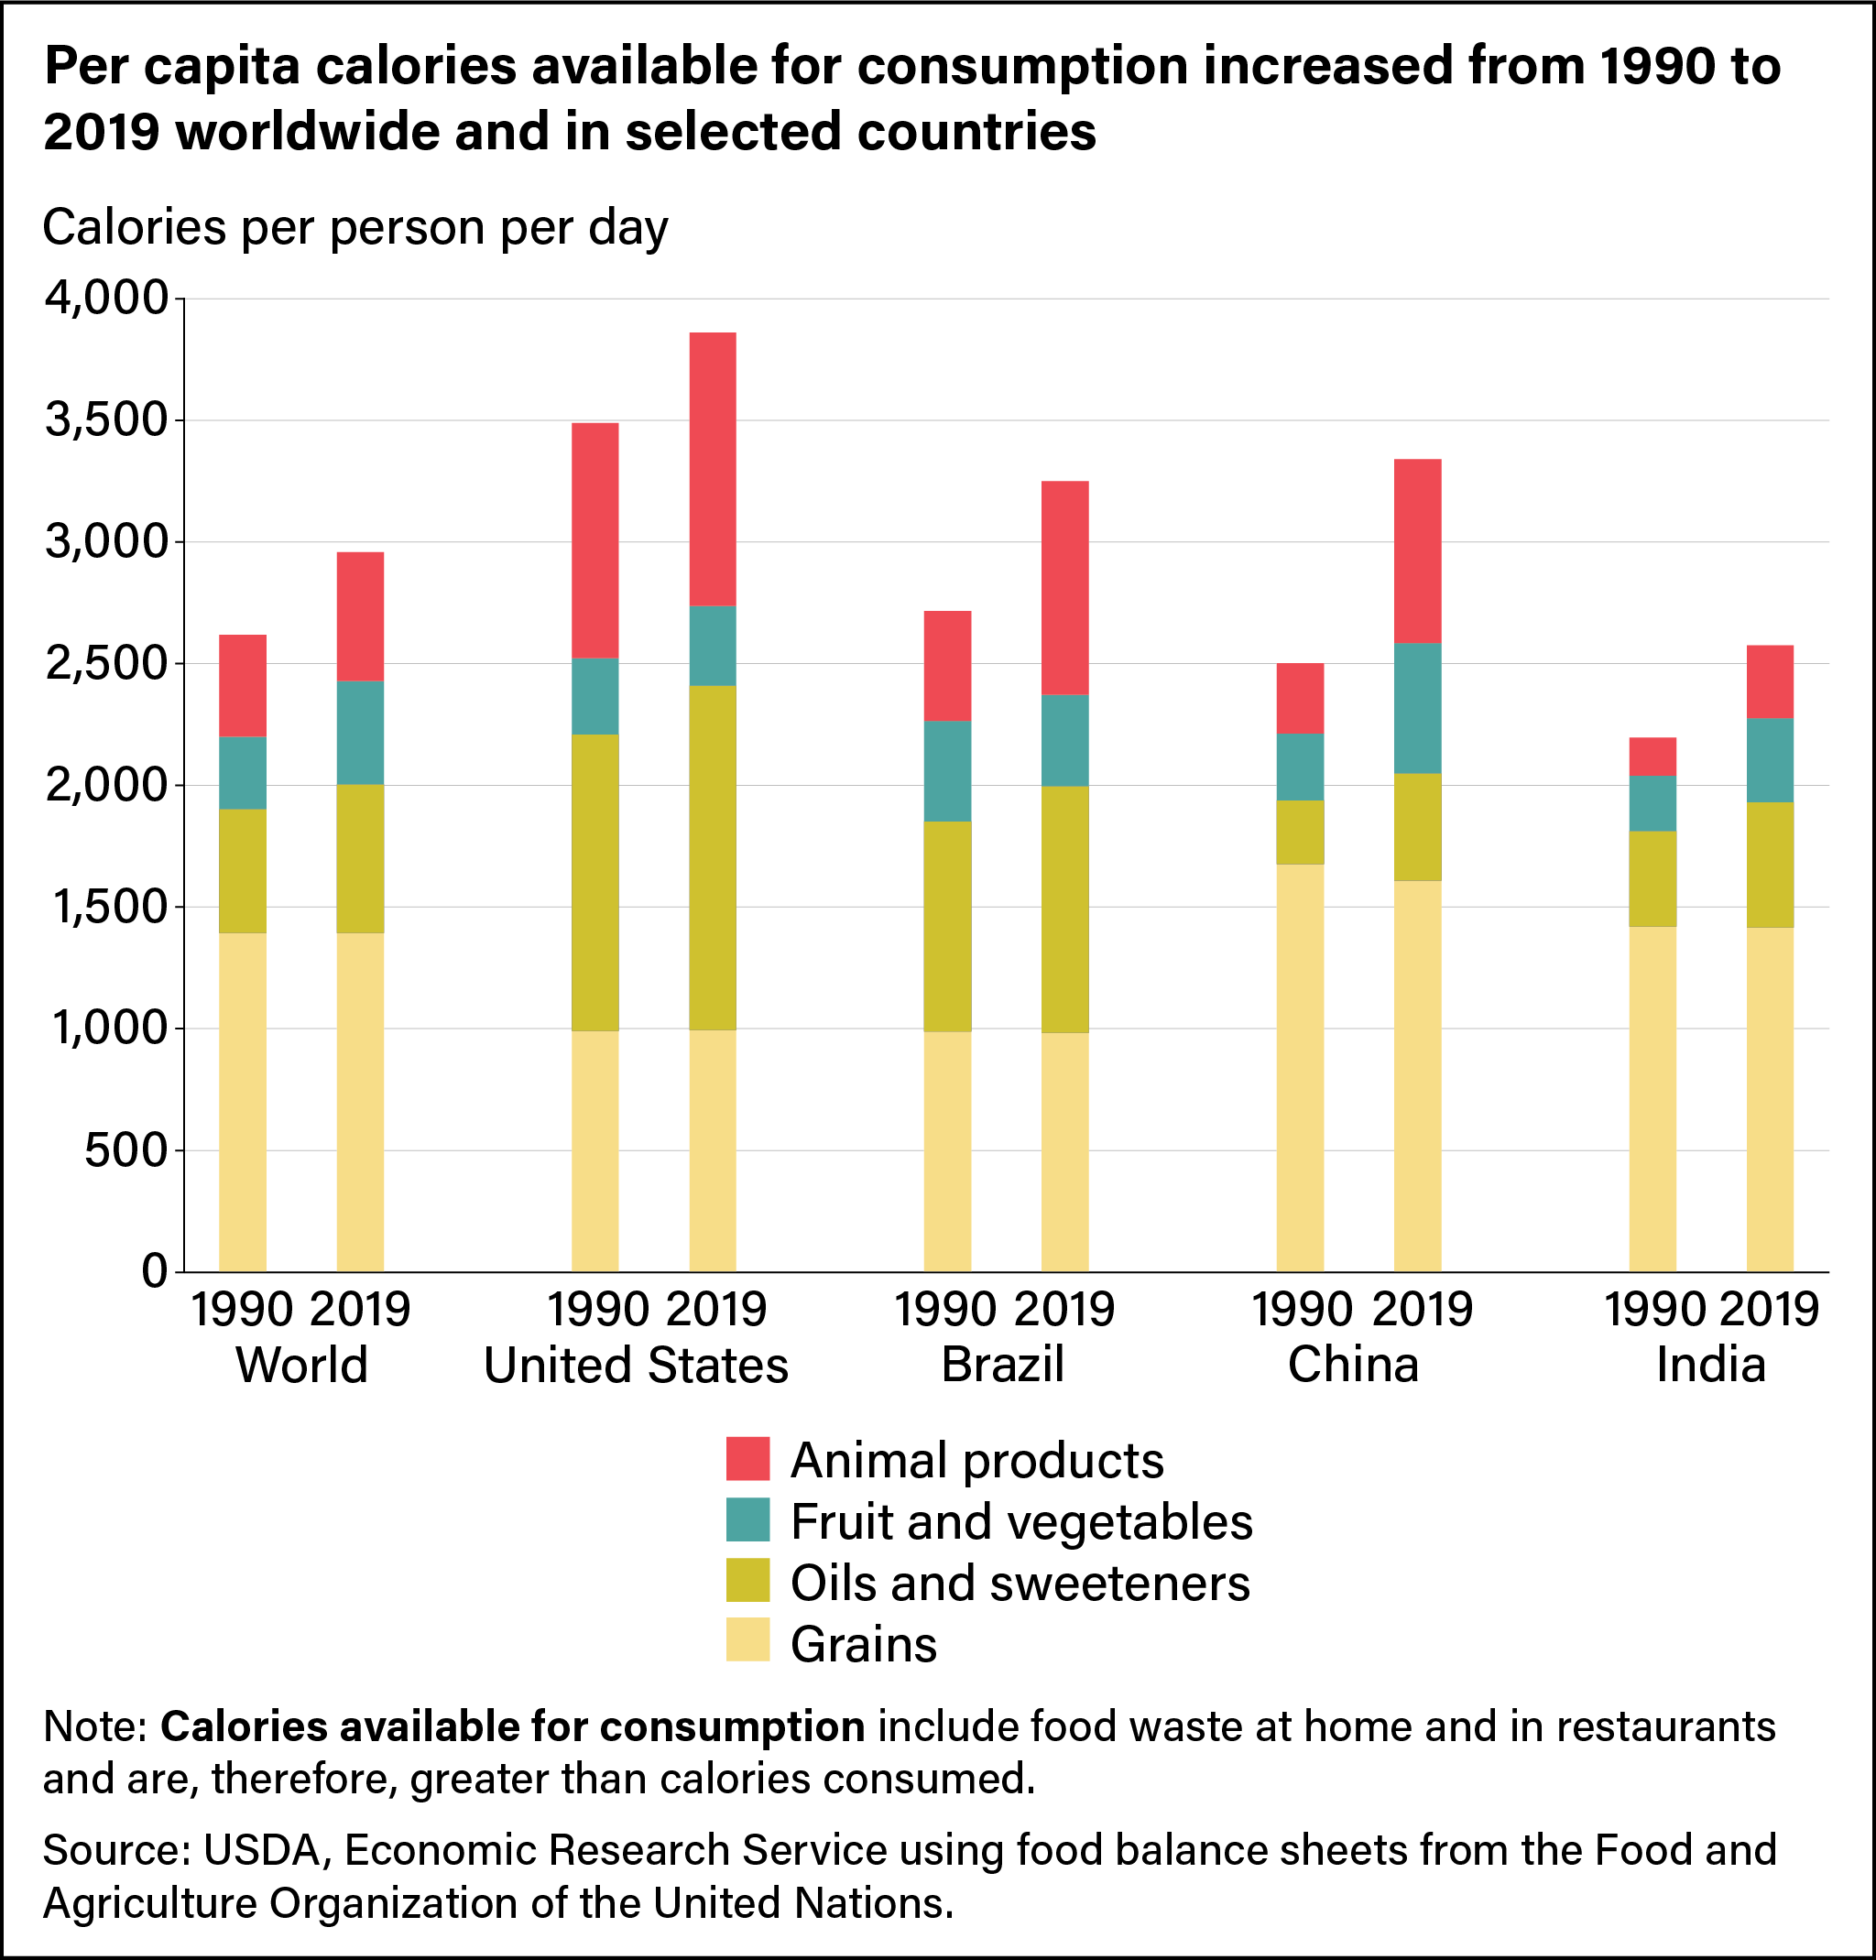
During the 30-year period spanning from 1990 to 2019, world population grew by 45 percent, and food produced by the global agriculture system increased by 61 percent, as measured by calories available for food consumption. The calories available from some food groups—especially fruits and vegetables, vegetable oils, and animal products—increased faster than population growth in those 30 years. Calories available from grains increased at about the same rate as world population.
The world average of total calories available per person per day, as shown in the chart below, masks large differences among countries in total calories and for each of the four food groups (animal products, fruit and vegetables, oils and sweeteners, and grains). For example, available calories of animal products per capita more than doubled in China and nearly doubled in Brazil during the period, as rising incomes drove increases in animal product consumption. Still, both countries had below the U.S. level for animal product consumption in 2019. At the same time, total per capita calorie consumption in India was lower than the world average in both 1990 and 2019.
World Spending on Food
The International Comparison Program of the World Bank is a statistical initiative aimed at calculating internationally comparable measures of Gross Domestic Product and provides key data for the economic analysis of world food consumption. The program’s dataset is the most comprehensive of its kind: The 2017 report covers 175 economies for which the full range of required data were available. The dataset breaks down spending for major consumption categories and food subcategories.
Researchers from USDA, Economic Research Service (ERS) summarized the underlying expenditure data by grouping all economies into low-, middle-, and high-income groups, which provides an indicator of food affordability. “Food at home” is the most important expenditure category for low- and middle-income economies, with average expenditure shares of 40 percent in low-income economies and 22 percent in middle-income economies. High-income economies, by contrast, spend on average just 10 percent of their consumption expenditures on food at home but 21 percent on housing (see chart below). Spending on food away from home, which increases with income, is included in the “restaurants and hotels” category.
Drivers of Food Production
Looking to 2050, six major drivers influence the path of global agriculture: population, per capita income, dietary preference, agricultural productivity, climate change, and biofuel production. For this article, ERS researchers focused on the first four, which affect food consumption, crop production, land use, and agricultural prices.
ERS researchers used population and crop production data to generate 10 scenarios aimed at assessing the production and consumption of crops and food products. Population projections are from the United Nations World Population Prospects. The world population in 2050 is projected to be 8.7 billion (under a low-fertility scenario), 9.7 billion (medium-fertility scenario), or 10.8 billion people (high-fertility scenario). Much of the population growth is projected to be in Sub-Saharan Africa.
Even if there were no change in individual diets, population growth alone would create a substantial increase in food demand through 2050. The static diet scenario holds worldwide diets at 2011 levels with medium population growth. Other scenarios of the 10 studied were based on a general pattern of increasing total per capita calories and a greater proportion of animal products and vegetable oils in the diet. This article provides results from the static diet scenario and two other scenarios: medium population growth with an income-driven diet, and high population growth with an income-driven diet. In the scenarios, crop productivity would increase over time, but at the same rate in each scenario.
Crop Calories and Food Calories
Measuring crop calories—the calories produced from crops, whether for human or animal consumption—is an indicator of the size of global agriculture and pressure on the land base. Final (food) calories are those that are available for food consumption, covering all food products. At the world level, crop calories are greater than food calories, mostly because of losses when feed is converted to meat, dairy products, and eggs. Some losses also occur during processing to other food products. Calories available for consumption include food waste at home and in restaurants and are therefore greater than calories consumed. At the country level, the relationship of crop calories to food calories depends on international trade.
Projections to 2050
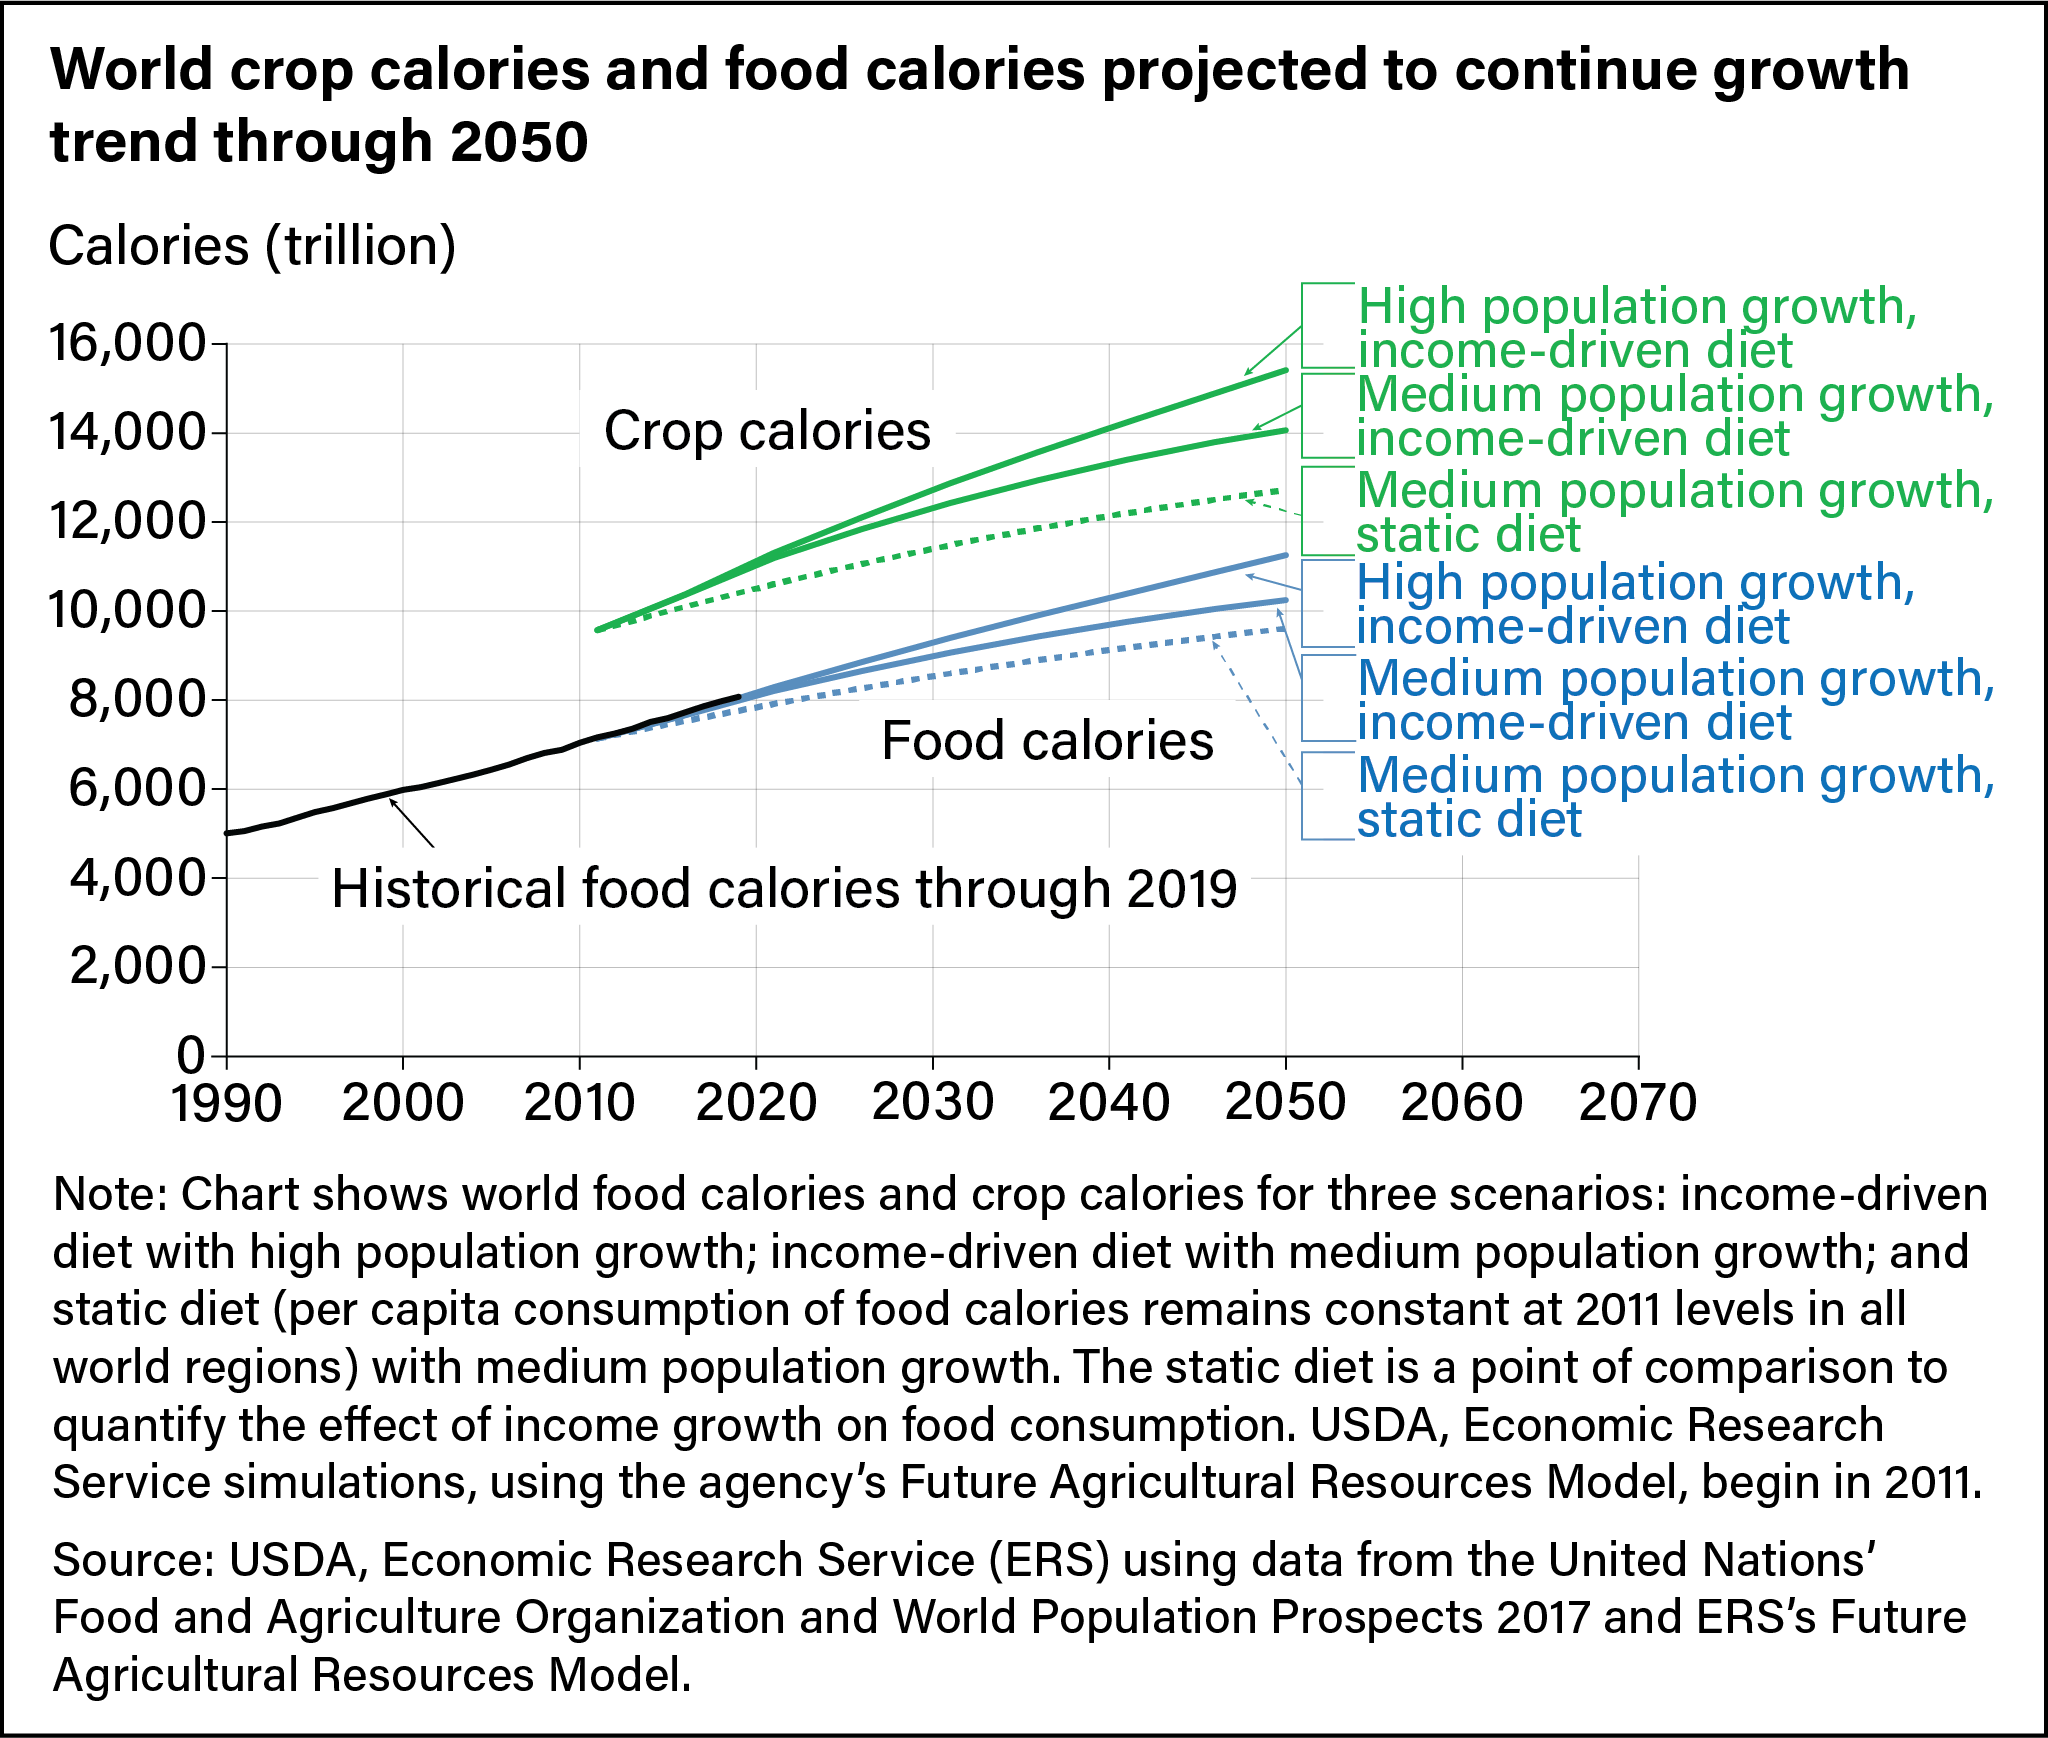
The chart below shows the projected growth path of world food calories and crop calories for the three scenarios from 2011 to 2050, along with the historical food calorie trajectory from 1990 to 2019 as provided by the Food and Agriculture Organization of the United Nations. Food calories available for consumption totaled 7,140 trillion in 2011, with the production of crop calories at 9,570 trillion. Under medium-population growth, world agriculture production would have to increase to 14,060 trillion crop calories to feed 9.7 billion people in 2050, a 47-percent increase from 2011. In a high-population growth scenario, 15,410 trillion crop calories would be needed to feed 10.8 billion people, a 61-percent increase in calories from 2011.
In the income-driven scenarios, researchers assumed that as per capita incomes rise, people would increase their overall consumption of calories and consume a higher proportion of animal products such as meat and dairy. They compared these scenarios to a static diet scenario in which per capita food consumption remains constant to show the effect of income growth. Historical food calorie data in 2019 are nearly the same as in the income-driven scenarios (solid blue lines in the chart), but greater than in the static diet scenario (dashed blue line). This indicates that world food consumption responded to increases in per capita income between 2011 and 2019.
Production of crop calories is driven by demand for food calories, which in turn is driven by changes in population and income. Across the three scenarios in the chart, crop calories (shown using solid and dashed green lines) span a wider range than food calories because of increasing per capita consumption of animal products.
This article is drawn from:
- Sands, R., Meade, B., Seale, Jr., J.L., Robinson, S. & Seeger, R. (2023). Scenarios of Global Food Consumption: Implications for Agriculture. U.S. Department of Agriculture, Economic Research Service. ERR-323.
You may also like:
- World population prospects 2022: Methodology of the United Nations population estimates and projections. (2022). United Nations, Department of Economic and Social Affairs, Population Division.
- Purchasing power parities and the size of world economies: Results from the 2017 International Comparison Program. (2020). World Bank. Doi.org/10.1596/978-1-4648-1530-0.
We’d welcome your feedback!
Would you be willing to answer a few quick questions about your experience?