
Farm Businesses Well-Positioned Financially Despite High Interest Rates
- by Anil K. Giri and Dipak Subedi
- 7/2/2024
Highlights
- Debt has grown in the farm sector, reaching more than half a trillion dollars in 2023. Producers rely on numerous lenders, including the USDA, Farm Service Agency (FSA), to provide the financing needed to start, expand, or maintain a family farm. This authority is provided in the Farm Bill.
- Although debt has increased, assets also have increased, thereby improving the solvency of large, midsize, and small farms in 2022.
- The average debt-to-asset ratio—a measure of solvency—improved for small, midsize, and large farm businesses in 2022 compared with 2021.
- Younger farm operators (those aged up to 44 years) tend to have a higher debt-to-asset ratio. Still, in 2022, the ratio was low, at 15 percent, for this group of farmers.
For many farm businesses, the amount of debt they hold is a key factor of their ability to sustain and grow their operations. Data from USDA’s Agricultural Resource Management Survey (ARMS) show that 23 percent of U.S. farms held debt in 2022. Total farm sector debt is expected to reach more than half a trillion dollars in 2024, according to USDA, Economic Research Service (ERS) farm income forecasts as of February 7, 2024. Data on operating profit margin—the share of gross income that is profit—show that most midsize, large, and very large family farms reported operating profit margins above 10 percent in 2022. However, most small family farms had an operating profit margin of less than 10 percent, indicating potentially more financial vulnerability.
USDA’s Role in Lending
The USDA has a role in farm lending under Farm Bill provisions. The USDA, Farm Service Agency (FSA) and its predecessor, USDA, Farmers Home Administration, have provided loans to farmers since 1946. Under the credit provisions of Title V of the Farm Bill, USDA provides direct funding to eligible farmers as well as guarantees for the repayment of loans from commercial lenders. FSA services 8 to 10 percent of farms with loans, depending on the type of farm. Eligibility favors beginning farmers (with fewer than 10 years of experience operating farms) who cannot obtain credit elsewhere, which is a small portion of farm businesses. The 2018 Farm Bill raised limits on FSA’s direct loans and loan guarantee amounts. Increased limits allow for larger loans, with implications for total sector debt.
Within agriculture, most operating and capital loans are provided by commercial banks and the Farm Credit System. Therefore, issues related to who borrows and the amount borrowed have implications not only for the health of the farm sector, but also for community banks and rural communities.
Rising Interest Rates Add to Interest Expenses
In recent years, interest rates have risen, making the debt (especially new ones and those with variable interest rate) farmers’ hold more expensive. Since March 2022 until July 2023, the Federal Reserve increased the short-term Federal funds rate (the interest rate banks charge each other for short-term lending) 11 times, with the target range of 5.25 to 5.50 percent, a 23-year high. The rate has remained steady since July 2023. The Federal funds rate directly influences the interest rate that banks charge customers and indirectly influences longer term rates such as those for mortgages and savings accounts. The impact of this increase has affected the farm sector. ERS has projected farm interest expenses as the fastest growing production expense for 2023 at $34.9 billion, or almost $10 billion higher (inflation-adjusted) than in 2022.
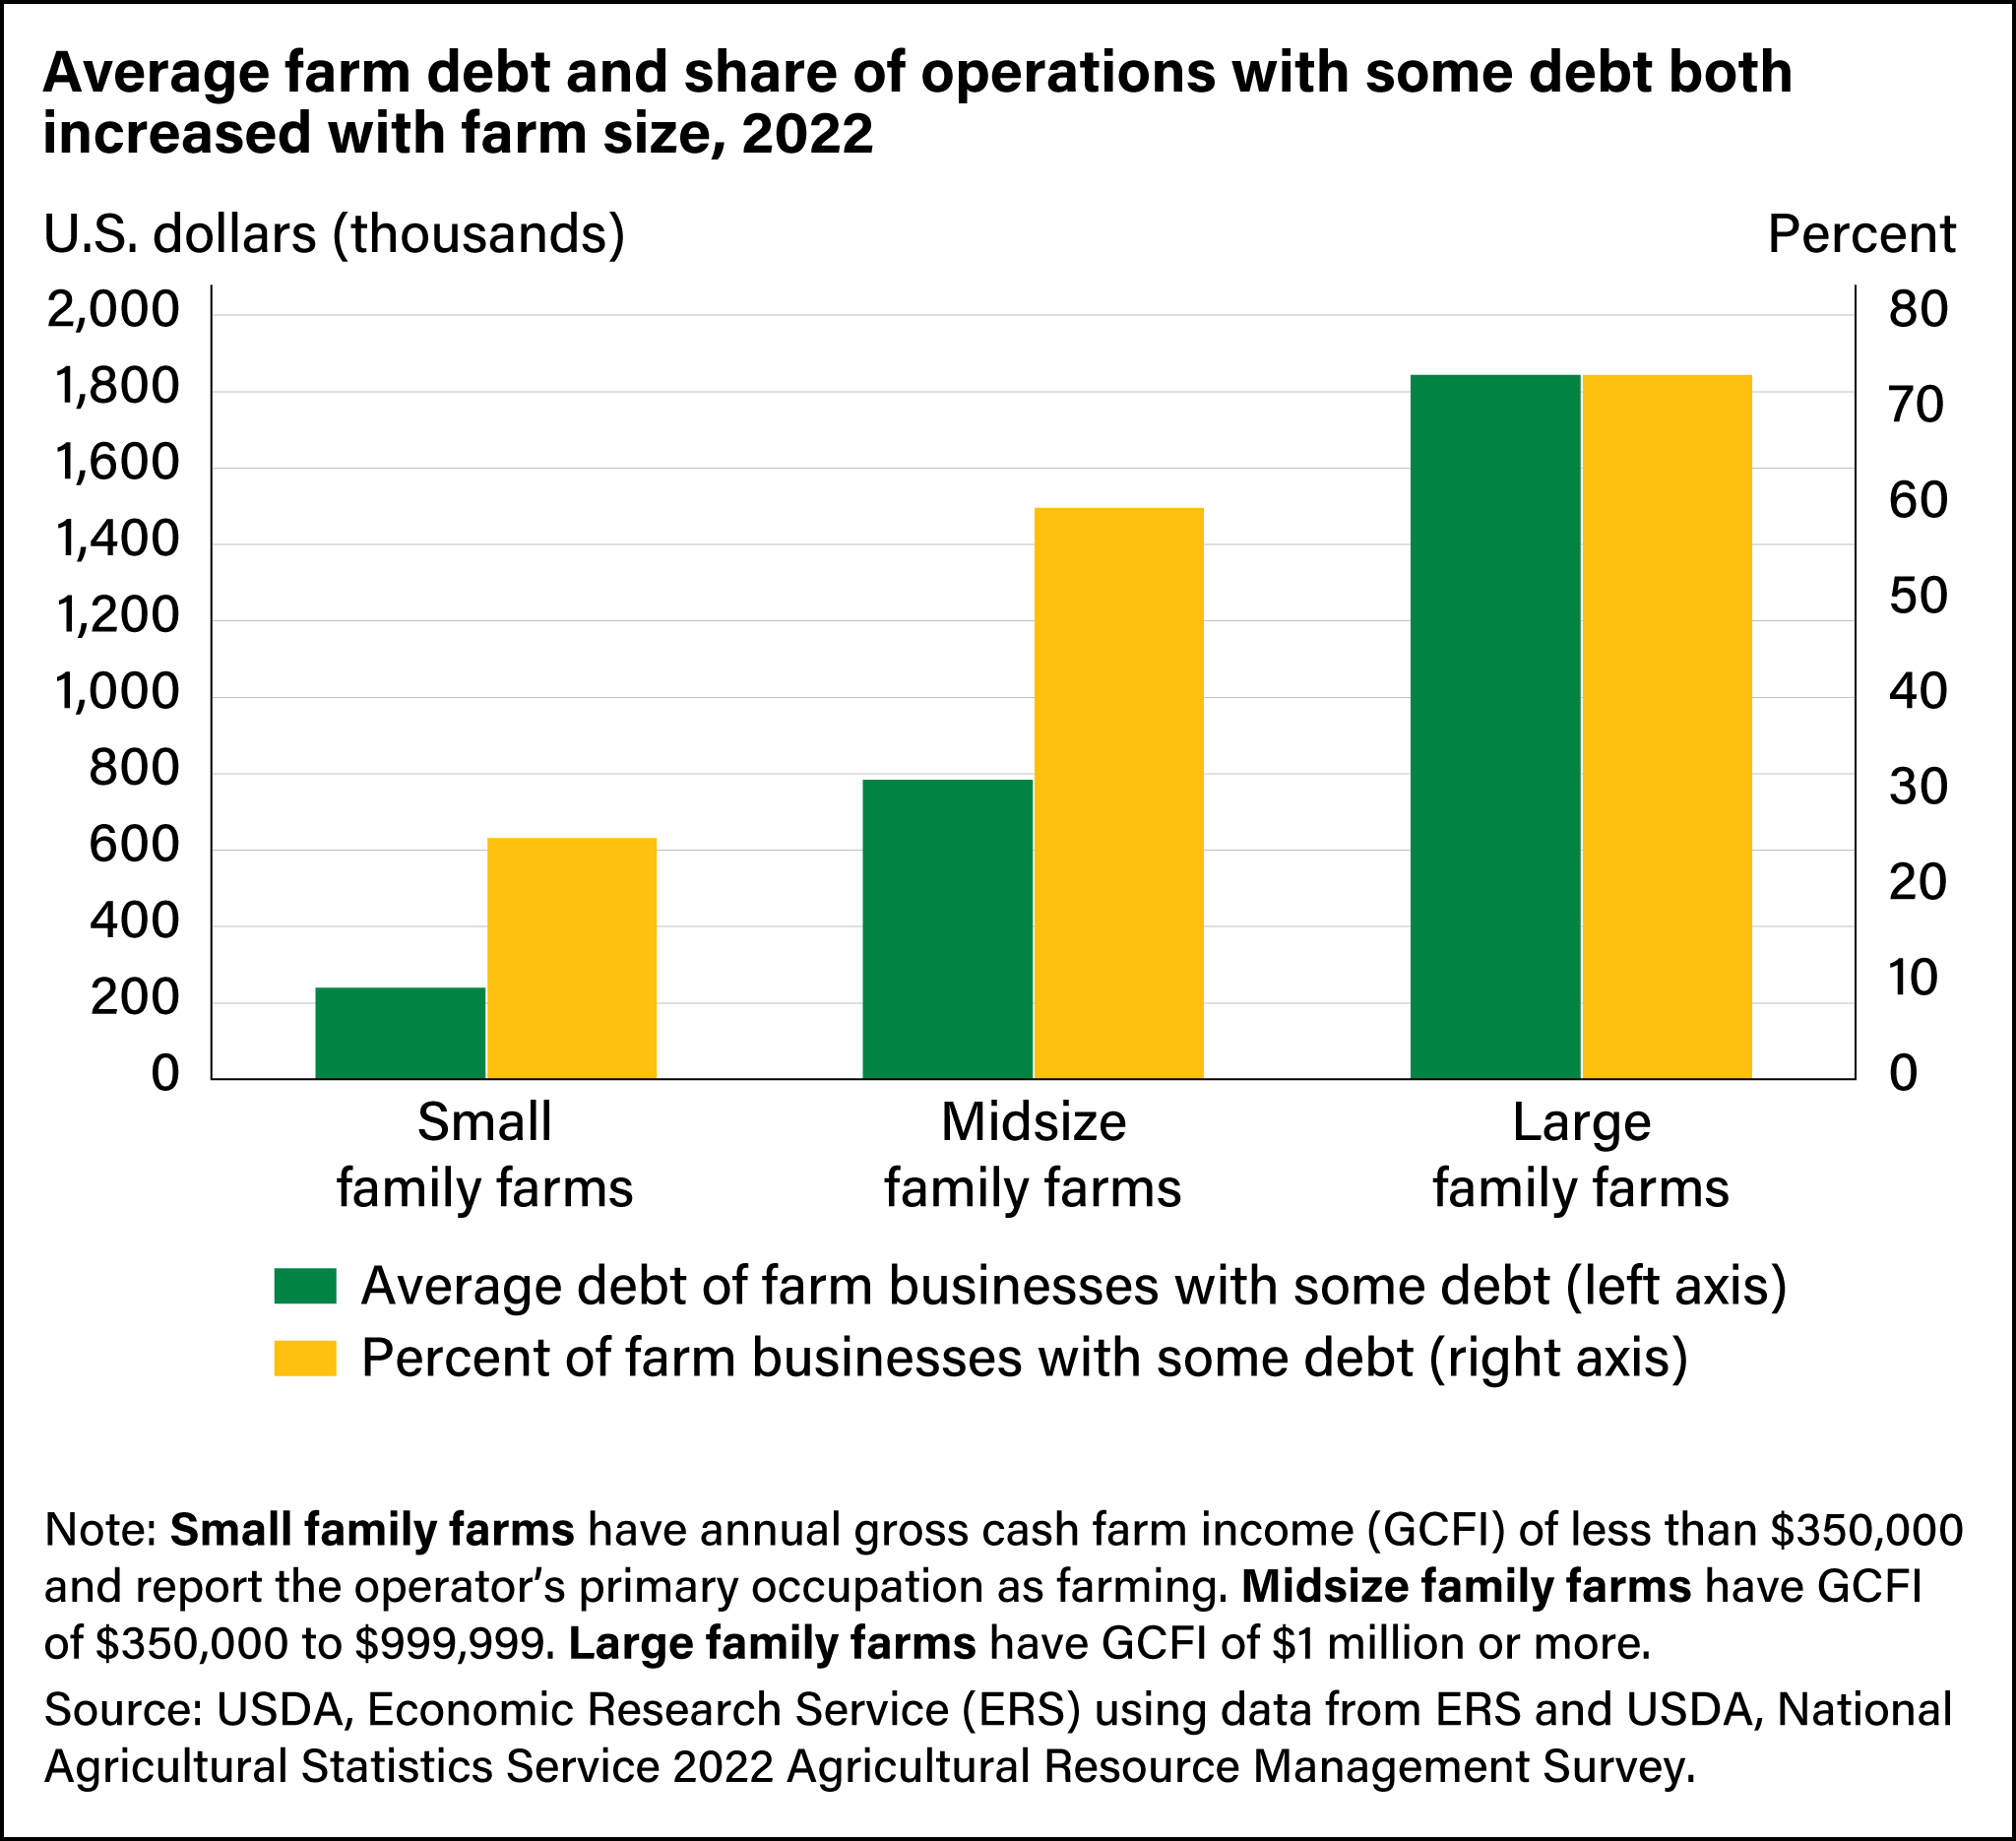
As Size of Farm Businesses Increases, So Does Average Debt and Share of Operations Holding Debt
ERS researchers use data collected annually through the ARMS to examine how debt use and leverage (measured as a farm’s debt-to-asset ratio) vary by farm size, specialization, and other characteristics such as operator age. Debt use varies widely within agriculture, reflecting differences in production, commodity and credit market conditions, and business and farm operator goals. Family farms can be classified as farm businesses and as residence farms (retirement or off-farm occupation). Farm businesses are farms with annual gross cash farm income (income before expenses) of at least $350,000 (midsize and large) or those with less than $350,000 in annual gross cash farm income (small) that report farming as the operator's primary occupation. For residence farms, annual gross cash farm income is less than $350,000 and the principal operator is retired or has a primary occupation other than farming.
| Farm business category | Annual gross cash farm income | Farm operator's primary occupation |
| Small family farms | Less than $350,000 | Farming |
| Midsize family farms | $350,000 to $999,999 | No requirement |
| Large family farms | $1 million or more | No requirement |
| Note: Family farms include any farm where the majority of the business is owned by the operator and individuals related to the operator. Gross cash farm income is annual income before expenses and includes cash receipts, farm-related income, and Government farm program payments. Source: USDA, Economic Research Service. |
||
In 2022, farm businesses represented less than half (48 percent) of all U.S. farms, and residence farms made up the other 52 percent. Yet, farm businesses held 88 percent of the sector’s total farm debt. They also held more than 70 percent of the sector’s assets and accounted for 95 percent of the total value of production.
Large operations typically have real estate debt and higher operating expenses financed by credit. In 2022, almost three-fourths (74 percent) of large family farms had some debt compared with one-fourth of small family farms. Sixty percent of midsize family farms had some debt. Large farms are not only more likely to have debt, but also to hold more debt than midsize and small family farms. For farms with debt in 2022, the average debt of large family farms was more than $1.8 million, compared with $239,567 for small family farms and $783,500 for midsize farms.
Solvency of Farm Businesses
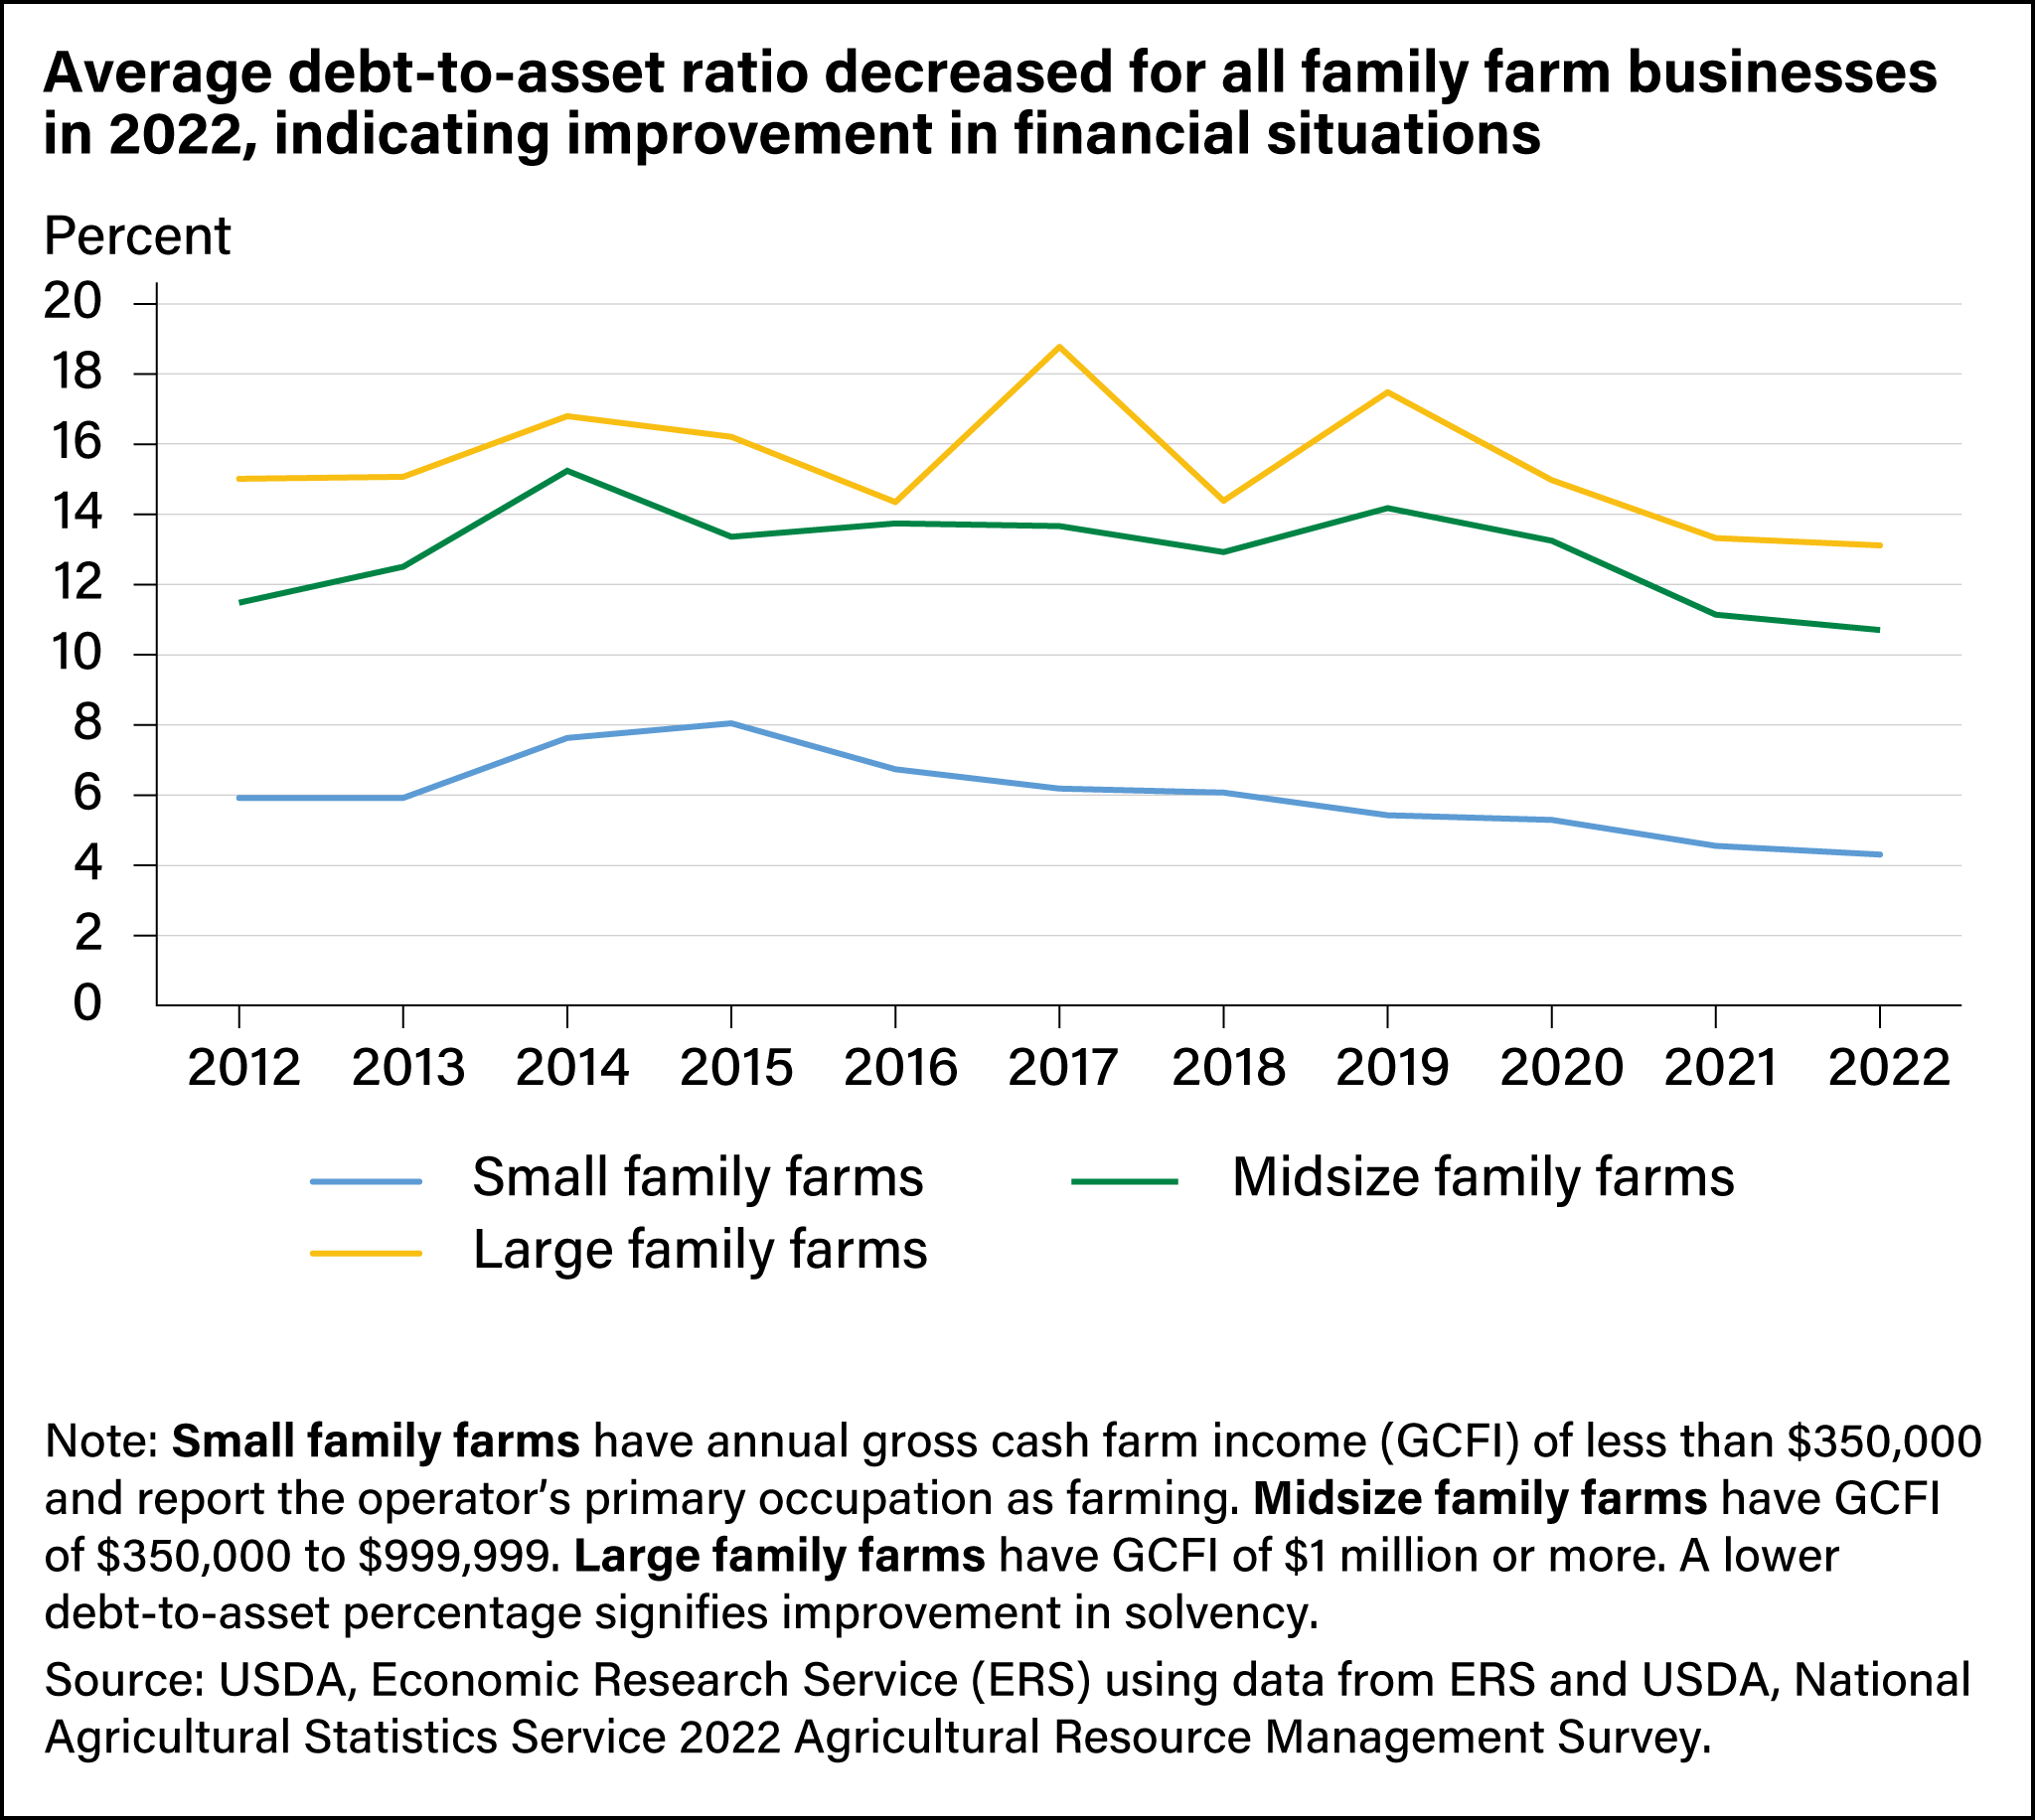
Despite the increase in debt, solvency metrics suggest farm businesses have not become more financially stressed in recent years. Solvency refers to the ability of a farm or ranch operation to satisfy its debt obligations when they are due. One of the most common and popular methods for measuring solvency is the debt-to-asset ratio. The debt-to-asset ratio is calculated by dividing the debt for a given year by the assets, thus providing a measure of leverage (the amount of debt used to finance assets). A low debt-to-asset ratio is preferred to a higher one, as lower ratios indicate greater capacity to pay off debt. The debt-to-asset ratio provides insights into farm businesses’ risk exposure, ability to overcome adverse financial events, meet long-term debt obligations, and continue future operations.
The average debt-to-asset ratio for all three types of farm businesses improved in 2022 compared with 2021. Generally, a debt-to-asset ratio of above 55 percent indicates financial stress. The average debt-to-asset ratio for all three classes of farm businesses has been below the 55 percent threshold for the past decade. Furthermore, in 2022, the debt-to-asset ratio was lower than the 10-year average for all farm business types. Large family farm businesses had the highest debt-to-asset ratio at 13.1 percent, followed by midsize family farm businesses at 10.7 percent, and small family farm businesses at 4.3 percent.
Solvency of Farm Businesses by Commodity Specialization
Farm businesses specialize in the production of particular commodities, leading to different financing requirements. For instance, some farm enterprises such as dairy and poultry generally require higher capital costs (to build milking parlors or poultry houses) and are highly leveraged. Farm businesses specializing in crops have benefited from an increase in farmland values, which lower leverage by increasing the value of the operations’ assets.
In 2022, the average debt-to-asset ratio was highest for farm businesses specializing in poultry. The average debt-to-asset ratio was highest for midsize poultry family farm businesses at 28.7 percent, followed by small poultry farm businesses at 26.7 percent. On the other hand, beef cattle farms in all three classes had the lowest average debt-to-asset ratio. Average debt-to-asset ratios were 2.3 percent for small family farm businesses, 5.1 percent for midsize farms, and 6.4 percent for large operations. For all types of farm businesses, the debt-to-asset ratio was below the 55 percent threshold.
| Farm specialty | Small family farm business | Midsize family farm business | Large family farm business |
| All farm businesses | 4.2 | 10.8 | 13.1 |
| Field crops | 4.3 | 12.1 | 14.4 |
| Specialty crops | 4.4 | 9.4 | 11.2 |
| Beef cattle | 2.3 | 5.1 | 6.4 |
| Hogs | 19.0 | 24.0 | 15.2 |
| Poultry | 26.7 | 28.7 | 17.4 |
| Dairy | 8.9 | 14.4 | 20.6 |
| Note: Small family farms have annual gross cash farm income (GCFI) of less than $350,000 and report the operator’s primary occupation as farming. Midsize family farms have GCFI of $350,000 to $999,999. Large family farms have GCFI of $1 million or more. Source: USDA, Economic Research Service (ERS) using data from ERS and USDA, National Agricultural Statistics Service 2022 Agricultural Resource Management Survey. | |||
Solvency of Farm Businesses by Age Group
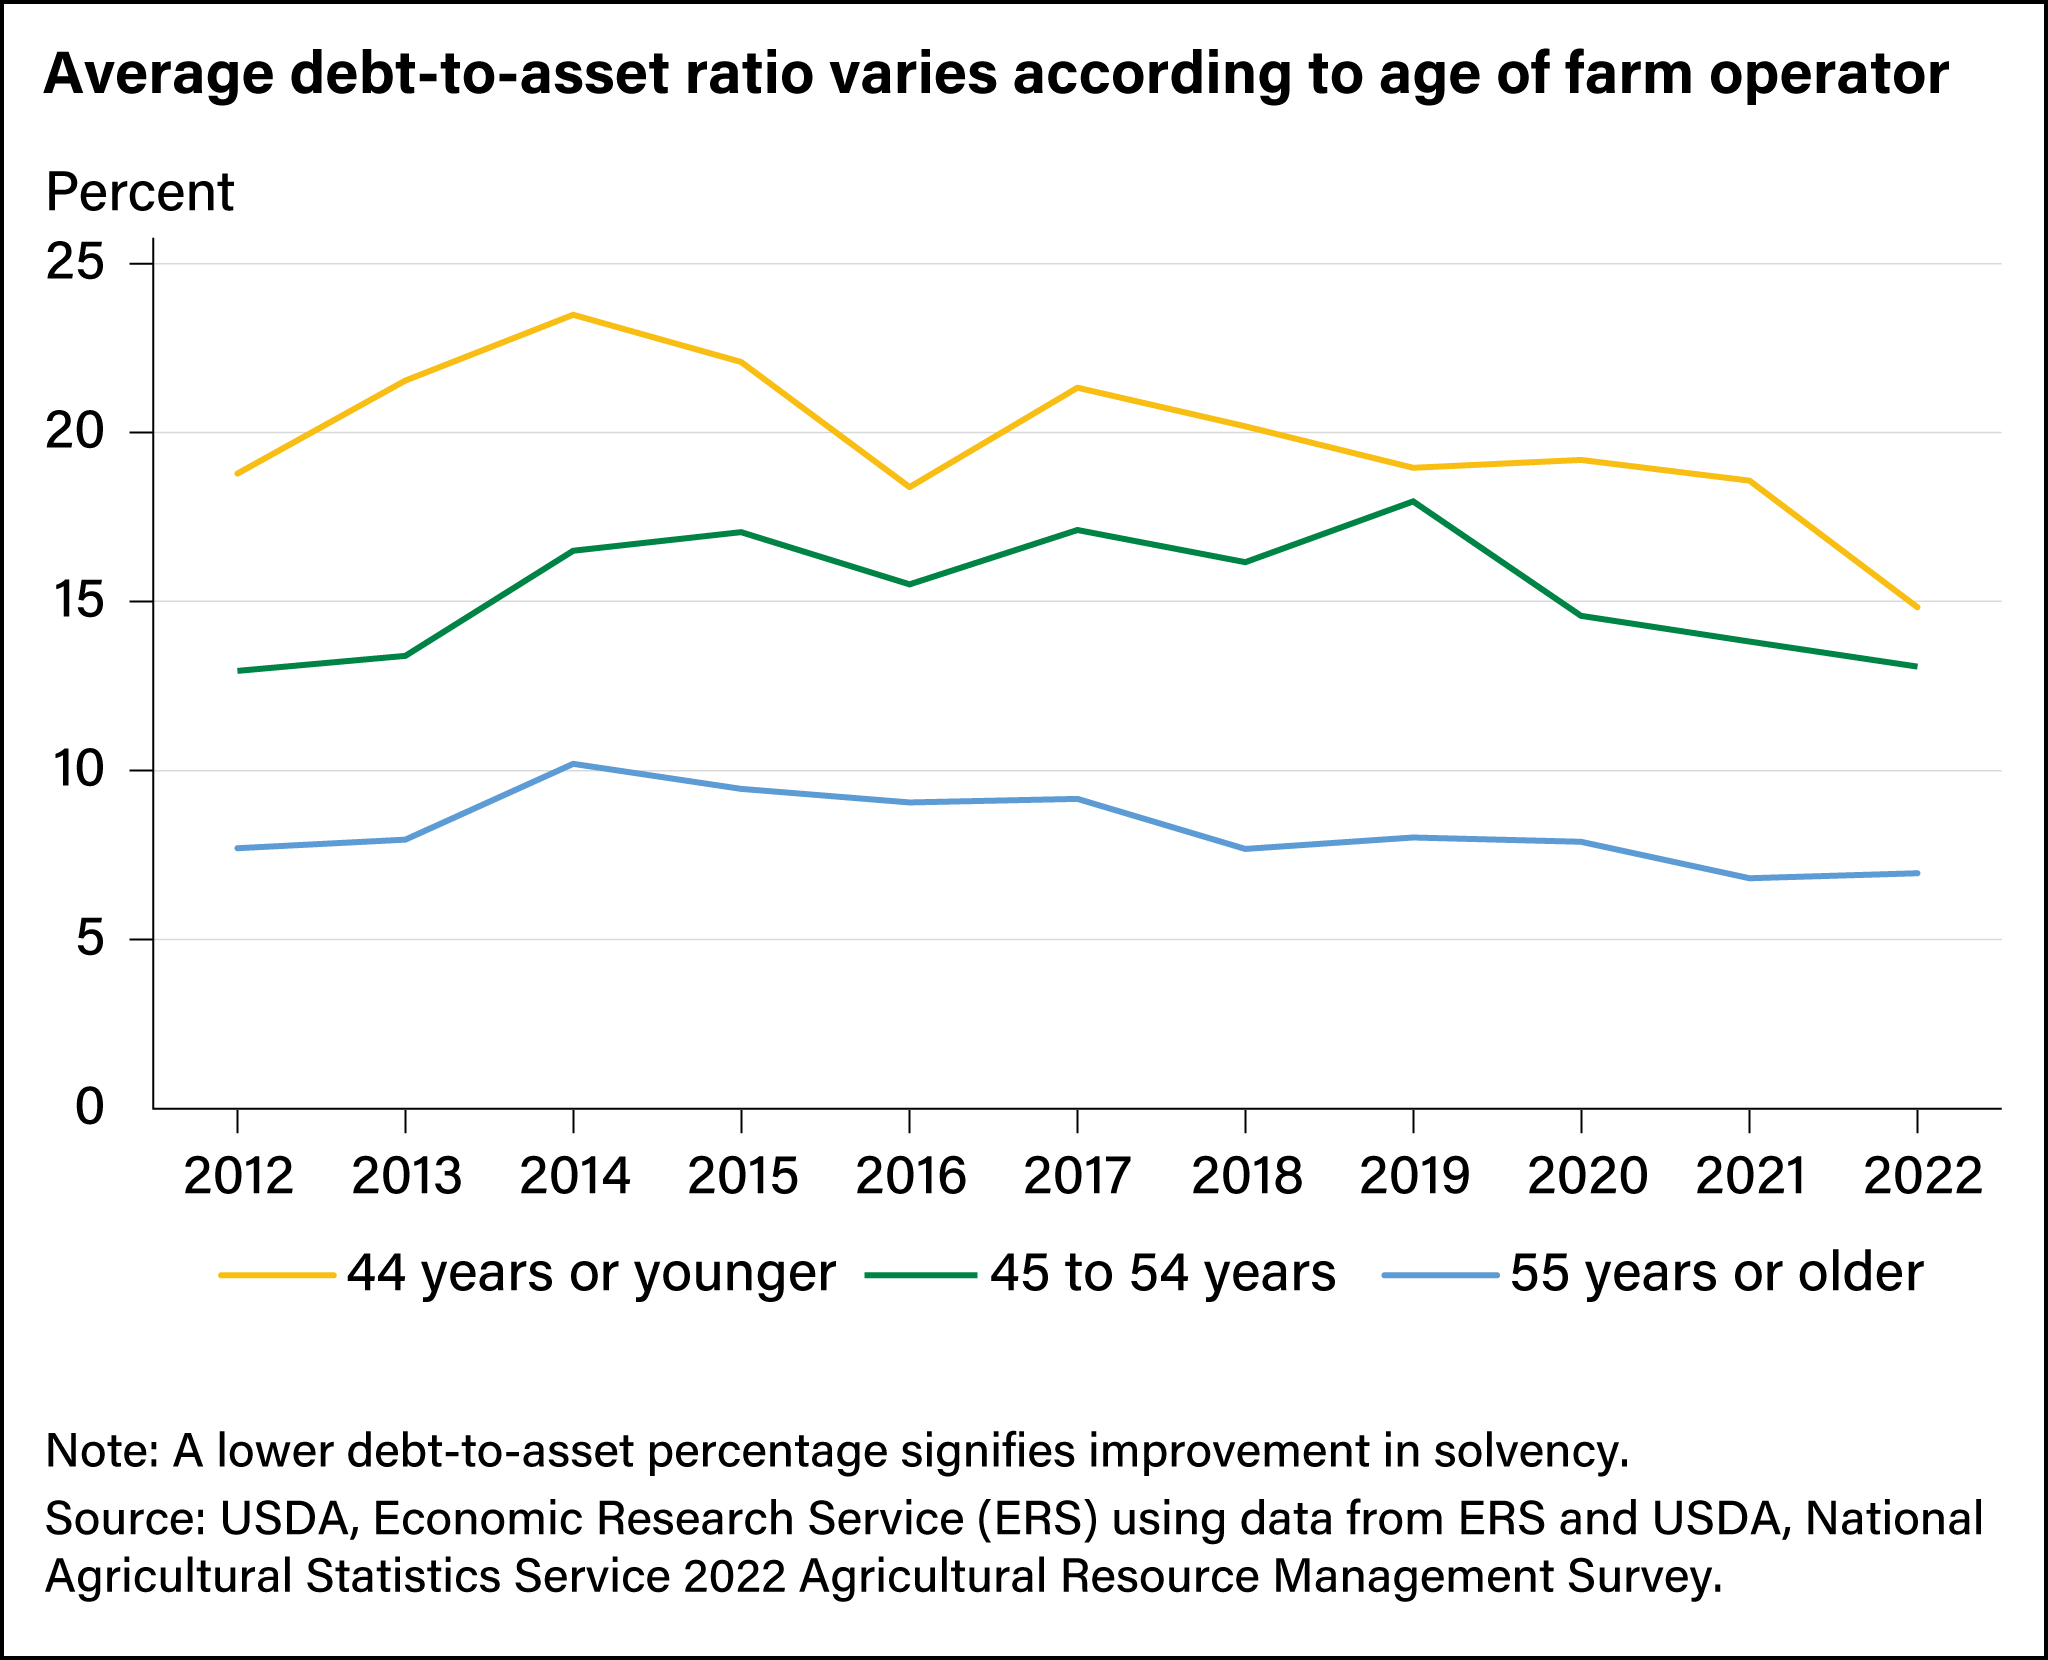
Debt-to-asset ratios vary according to the ages of principal operators. Generally, older operators are more likely to have paid off their debts and are less likely to take on new debt. On the other hand, younger operators may take on additional debt to expand their operation or to adopt new technologies. For the past decade, younger farm operators had a higher debt-to-asset ratio than older operators. Even so, the debt-to-asset ratio for three operator age categories— 44 years or younger, 45 to 54 years, and 55 years or older—declined or was flat in 2022 compared with previous years. Even the highest average debt-to-asset ratio held by an age category (15 percent for operators 44 years old or younger) was far below the 55-percent threshold.
This article is drawn from:
- Farm Income and Wealth Statistics. (n.d.). U.S. Department of Agriculture, Economic Research Service.
- Farm Sector Income & Finances. (n.d.). U.S. Department of Agriculture, Economic Research Service.
- Subedi, D. & Giri, A.K. (2024). Debt Use by U.S. Farm Businesses, 2012–2021. U.S. Department of Agriculture, Economic Research Service. EIB-273.
You may also like:
- ARMS Farm Financial and Crop Production Practices. (n.d.). U.S. Department of Agriculture, Economic Research Service.
- Patrick, K. & Ifft, J. (2014, April 8). Farm Businesses Well-Positioned Financially, Despite Rising Debt. Amber Waves, U.S. Department of Agriculture, Economic Research Service.
- Farm Household Income and Characteristics. (n.d.). U.S. Department of Agriculture, Economic Research Service.
- Lyons, G. (2019). Financial Conditions in the U.S. Agricultural Sector: Historical Comparisons. U.S. Department of Agriculture, Economic Research Service. EIB-211.
We’d welcome your feedback!
Would you be willing to answer a few quick questions about your experience?