Net Migration Spurs Renewed Growth in Rural Areas of the United States
- by John Cromartie
- 2/22/2024
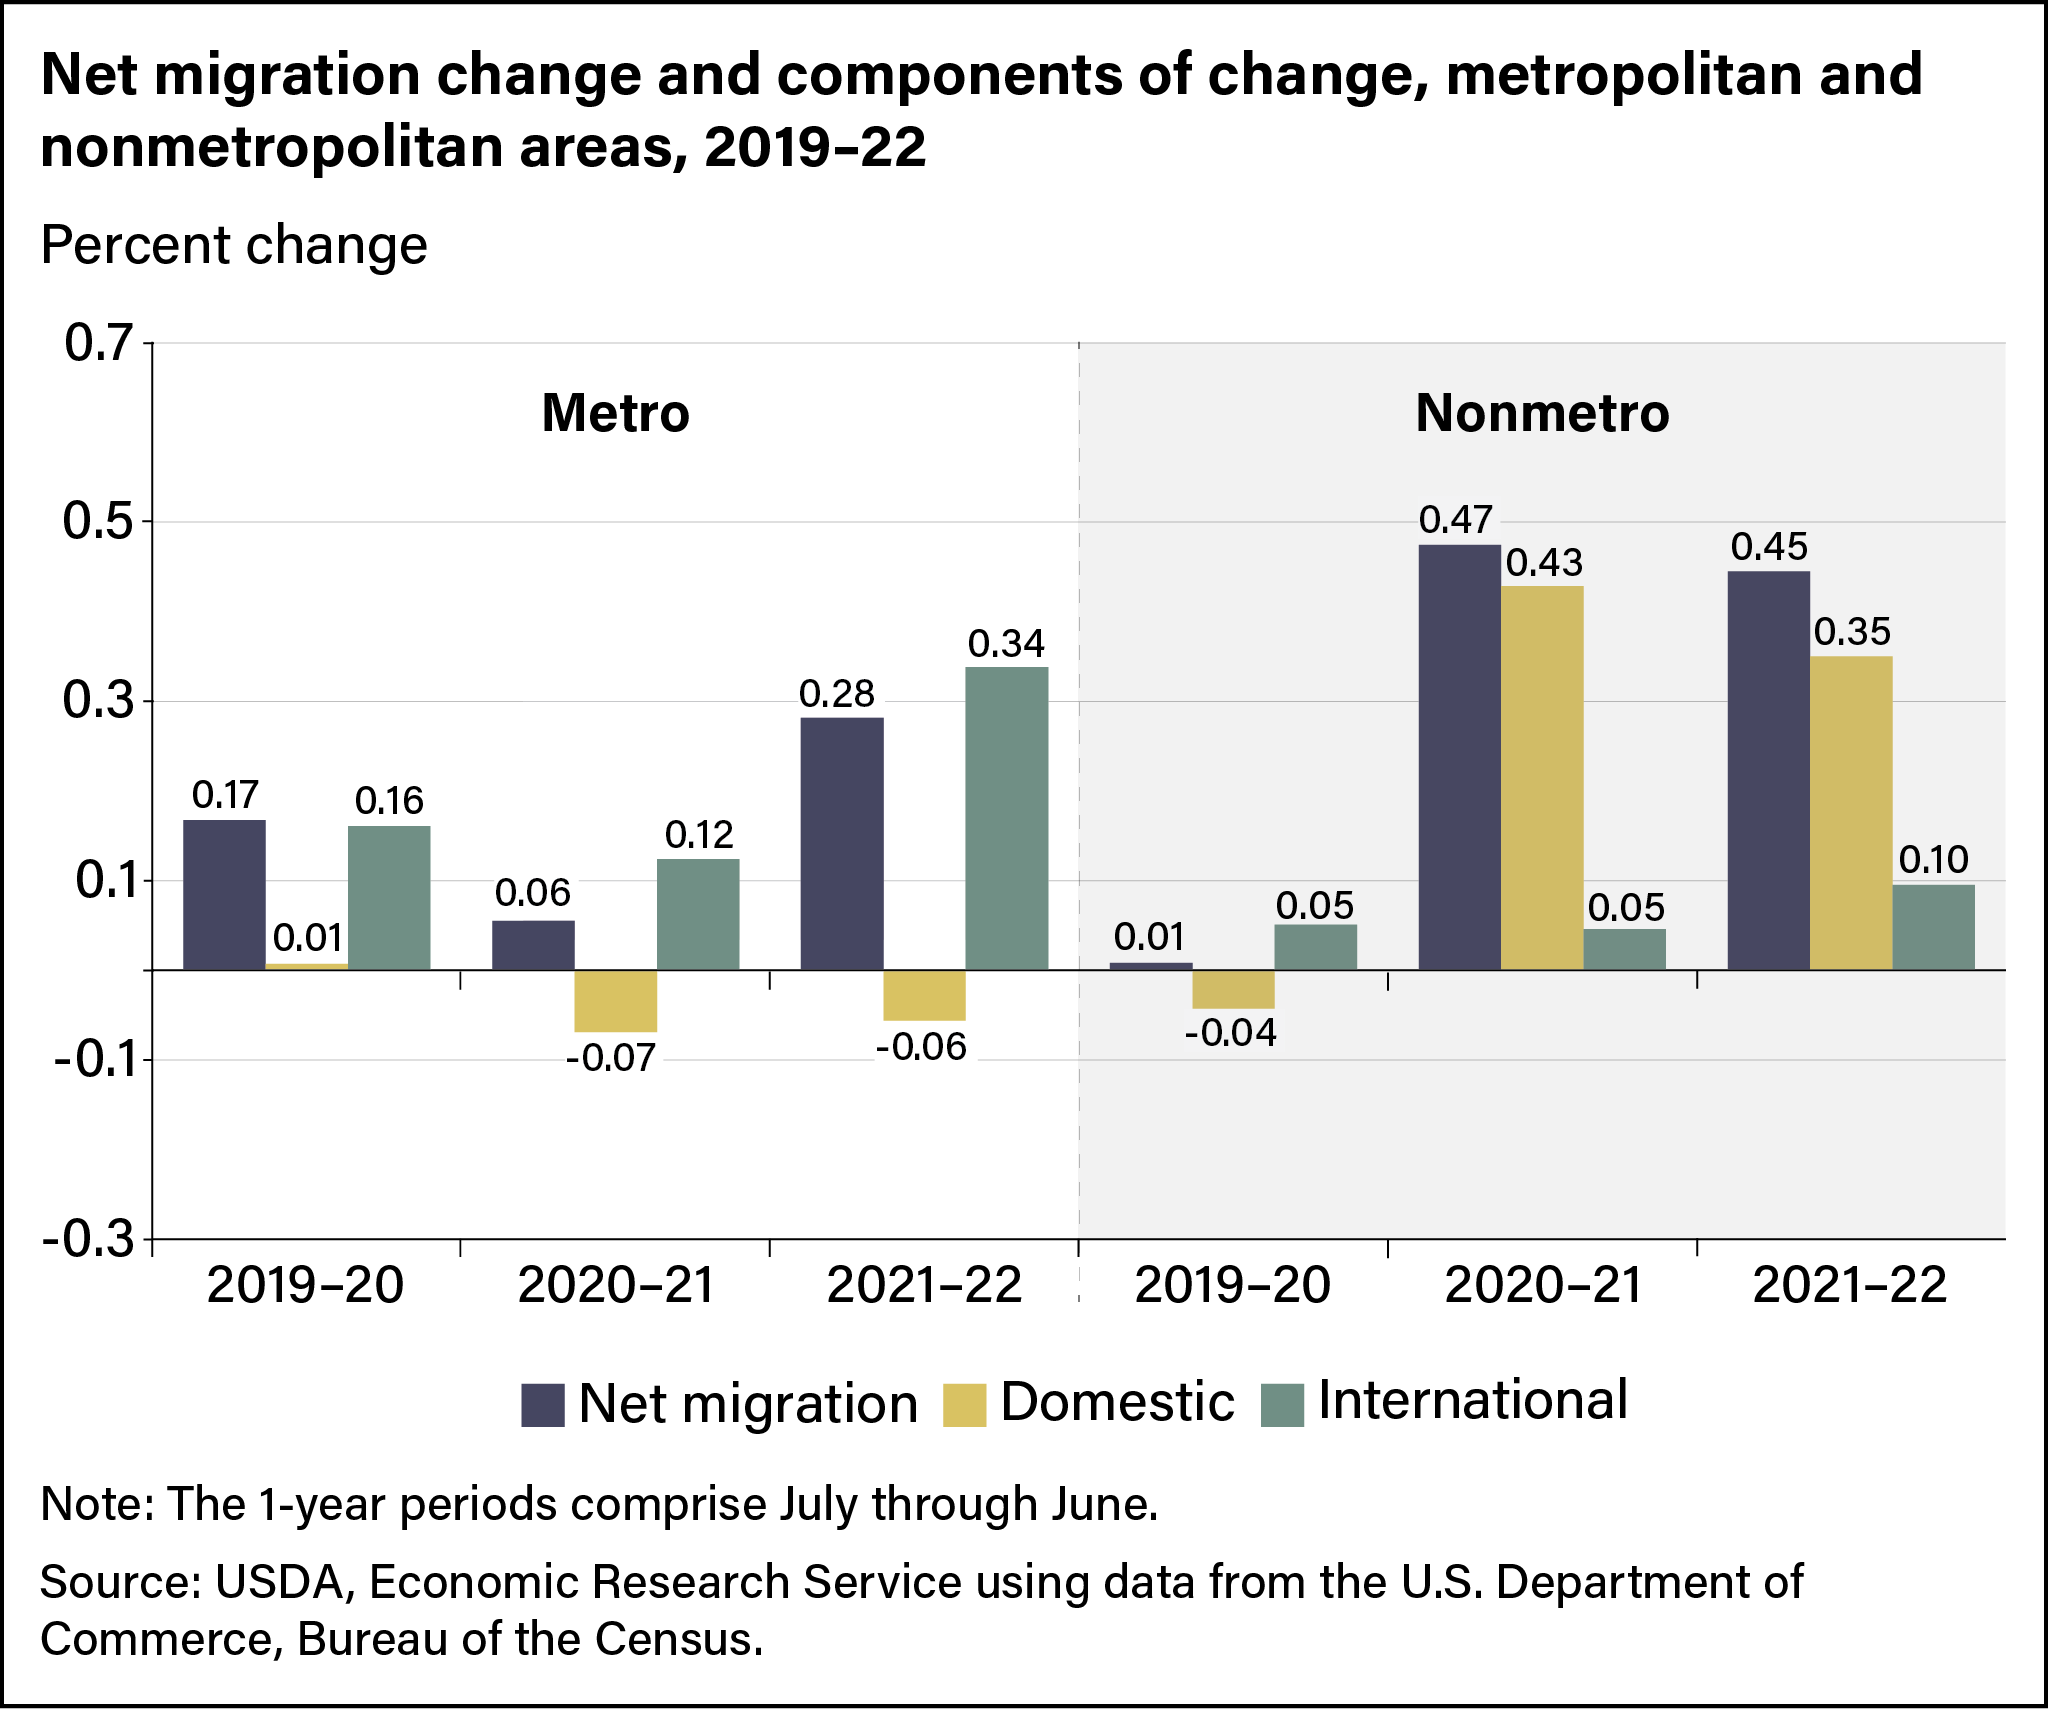
The U.S. rural (nonmetro) population is growing again after a decade of overall population loss, with growth of about a quarter percent from July 2020 through June 2022. This growth occurred because net in-migration (more people moving in than moving out) was larger than population decline from natural decrease (more deaths than births). The increase in remote work that followed the Coronavirus (COVID-19) pandemic contributed to this major shift in migration. Rural net migration rates were negative from 2010 to 2016 and near zero from 2017 to 2020, then jumped to 0.47 percent in 2020–21. Urban (metro) areas experienced a mirror-image decline in net migration, from 0.17 to 0.06 percent between 2019–20 and 2020–21.
Net migration can be divided into domestic net migration (occurring between areas within the United States) and international migration. The chart below shows that in 2020–21, more people moved from urban to rural areas than in the opposite direction, resulting in a 0.07-percent decline in urban population and a 0.43-percent gain for rural areas because of net domestic migration. Net domestic migration favoring rural locations continued in 2021–22. The overall increase in net migration for urban areas in the past 2 years was due almost exclusively to a near tripling of international migration, from a 0.12-percent gain in 2020–21 to a 0.34-percent gain in 2021–22.
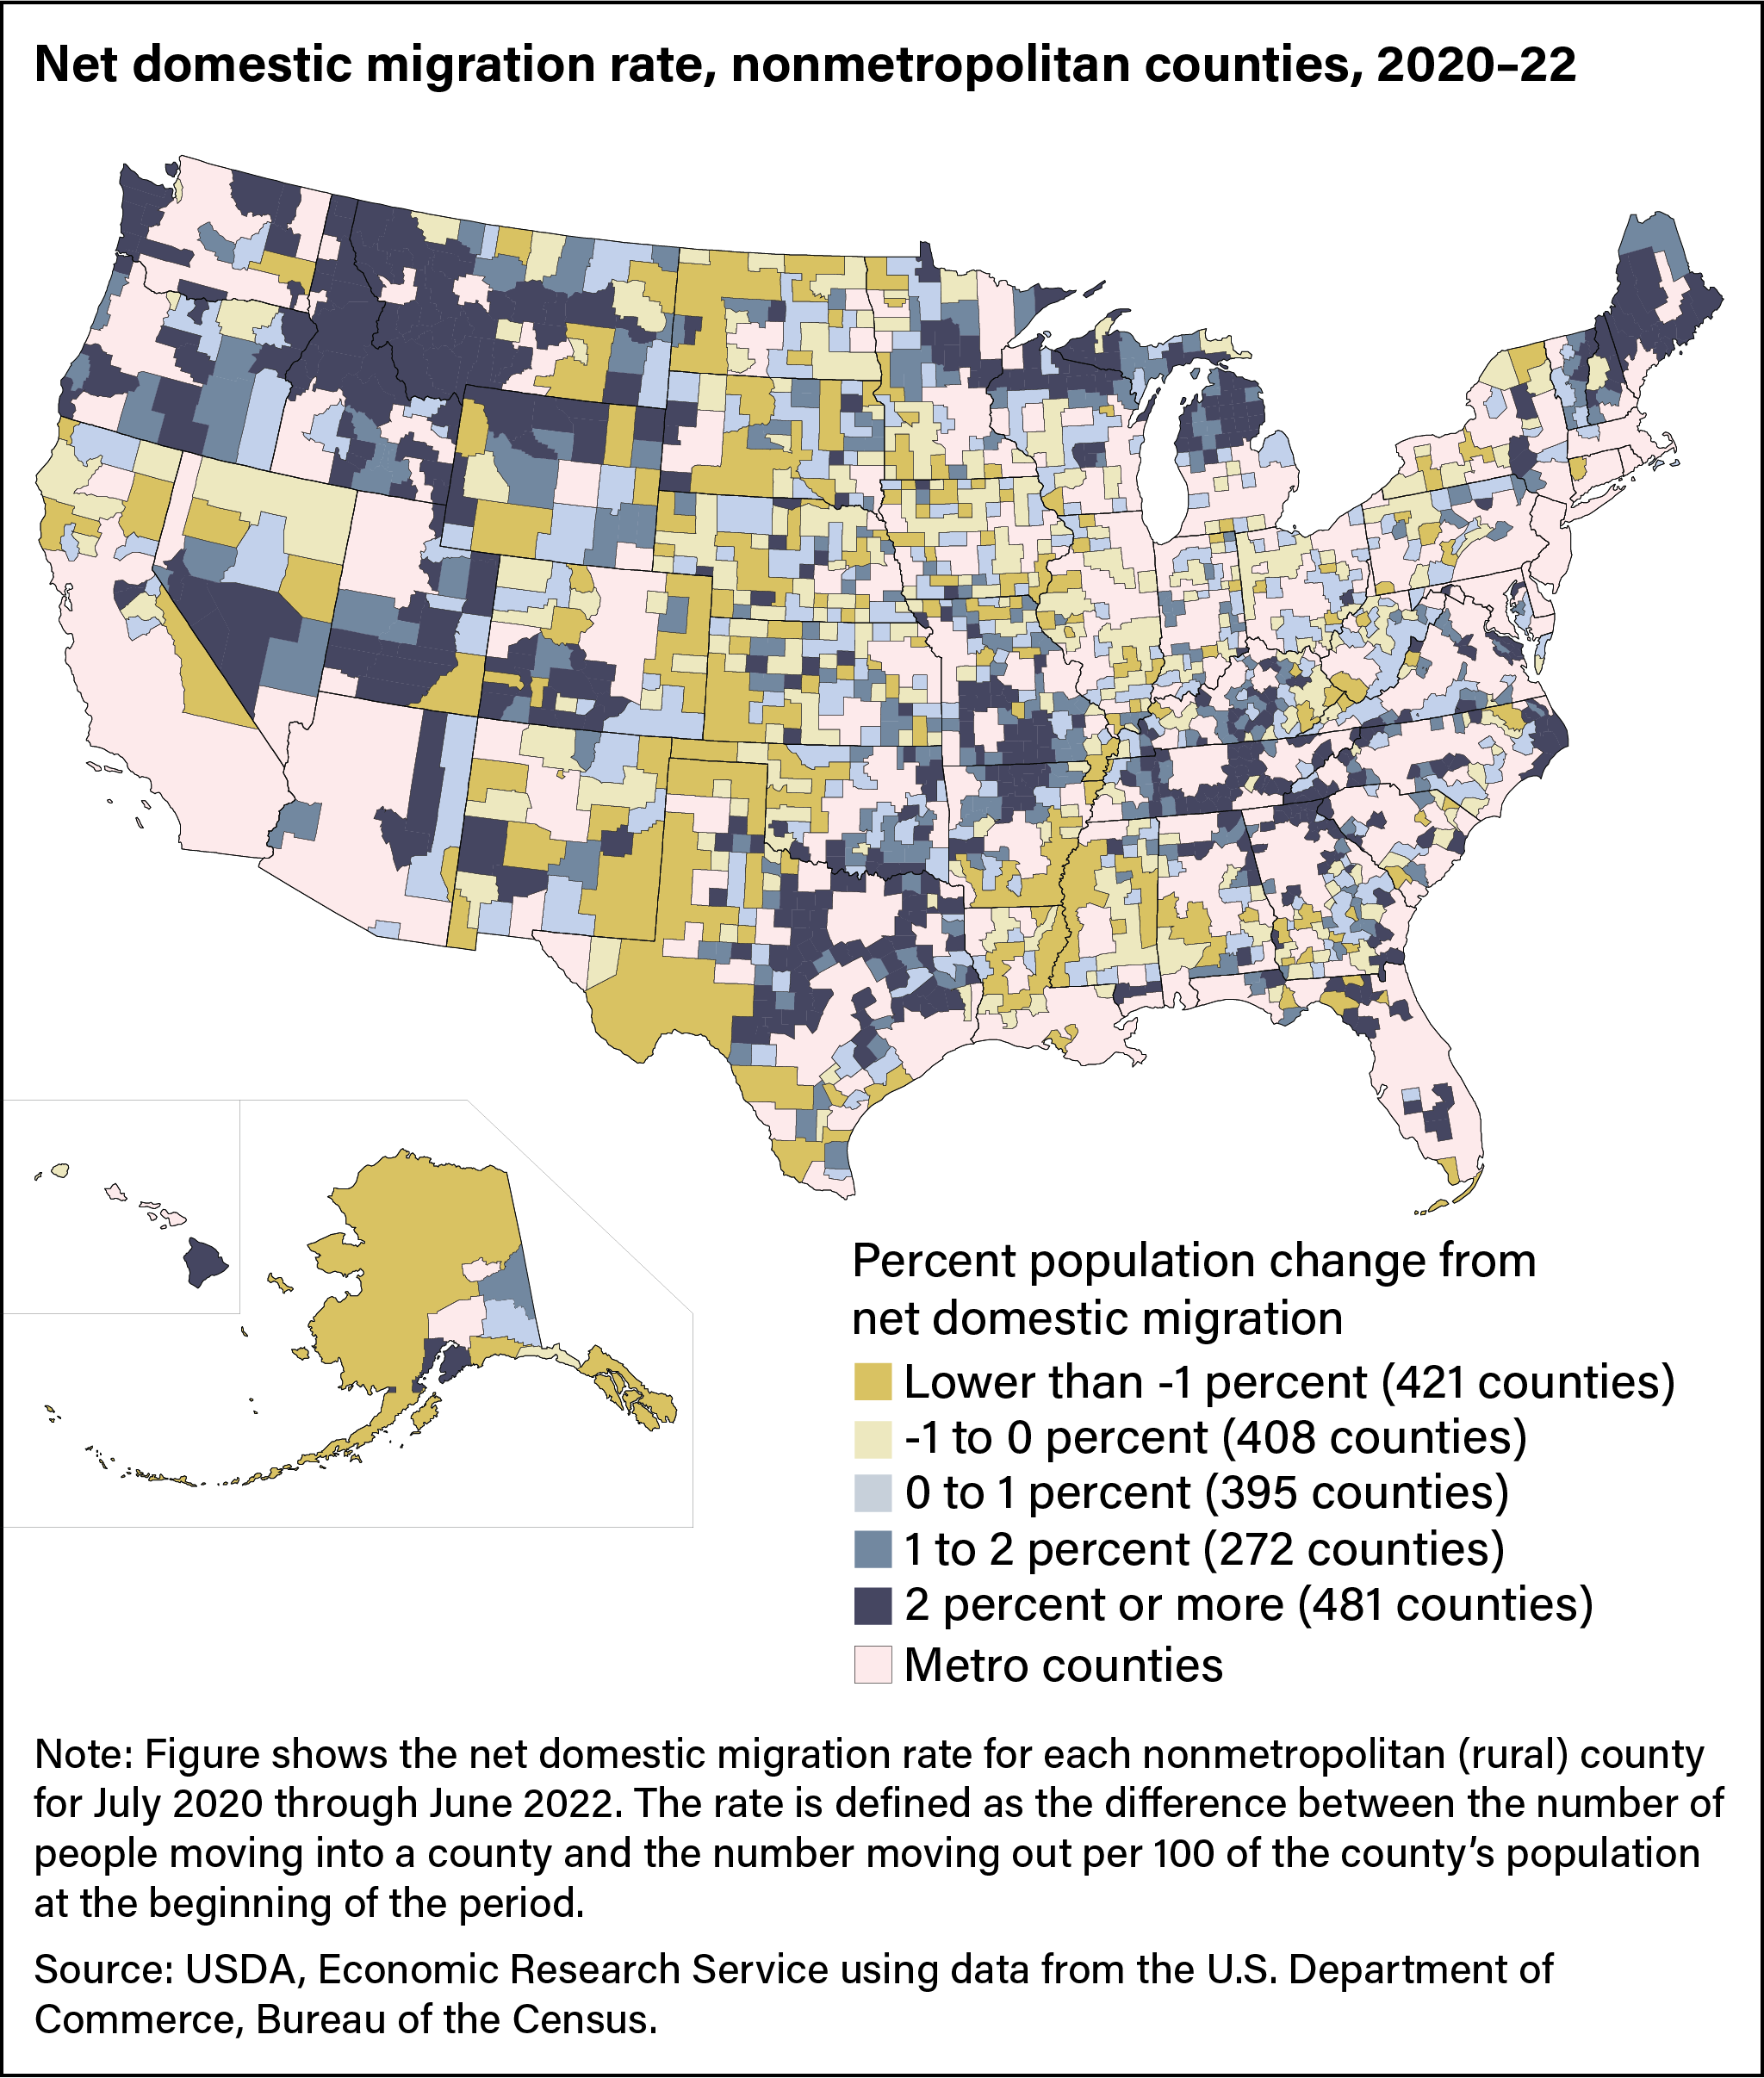
Population growth from domestic net migration was not evenly distributed across all rural counties. In the chart below, for the 2 periods of 2020–21 and 2021–22 combined (July through June in both periods), 829 rural counties (out of 1,976) continued to experience net domestic out-migration, with more than half of the counties losing more than 1 percent of their population. These included many high-poverty counties in the South, some farming counties in the Midwest, and several isolated and sparsely settled counties in the West. The majority of counties with net domestic out-migration were in the Great Plains, including some regions dependent on oil and gas extraction, which experienced COVID-19-related downturns in production. These regions include the Williston Basin in western North Dakota and eastern Montana, the Oklahoma Panhandle, southeastern New Mexico, and west Texas. Most rural counties saw gains in population because of net domestic migration, with 481 growing by 2 percent or more during 2020–22. These counties are typically found on the periphery of large urban areas and in recreation and retirement destinations, such as the northern Great Lakes, the southern Appalachians and Ozarks, and the Rocky Mountains. Based on previous research, this increase in “amenity migration” (people choosing locations to live based on quality-of-life factors) is not surprising given that baby boomer retirement is reaching its peak and remote work is allowing more locational freedom for working-age adults.
This article is drawn from:
- Davis, J.C., Cromartie, J., Farrigan, T., Genetin, B., Sanders, A. & Winikoff, J.B. (2023). Rural America at a Glance: 2023 Edition. U.S. Department of Agriculture, Economic Research Service. EIB-261.
You may also like:
- Population & Migration. (n.d.). U.S. Department of Agriculture, Economic Research Service.
- Atlas of Rural and Small-Town America. (n.d.). U.S. Department of Agriculture, Economic Research Service.


