
Children Were Only Age Group Improving Whole-Grain Intakes—School Foods Are a Key Factor
- by Joanne Guthrie, Biing-Hwan Lin and Travis A. Smith
- 9/14/2023
Highlights
- Between 1977–1978 and 2017–2018, whole-grain intake remained far below that of refined grains despite 2005 Federal recommendations that half of grains consumed be whole grains.
- Adults 65 years and above consistently consumed more whole-grain-dense diets from 1994–2018 than younger adults and children.
- Only children’s diets were more whole-grain dense in 2013–2018 than in 1994–2010. This improvement coincided with implementation of updated school meal nutrition standards that required regular inclusion of whole-grain-rich foods.
Since 2005, the Federal Dietary Guidelines for Americans (DGA) have recommended that people eat at least half of their grain intake in the form of whole grains. Whole grains contain all parts of the grain kernel; the process of refining grains removes some portions that contain vitamins, minerals, and dietary fiber. In the United States, most refined grains are enriched with some vitamins (thiamin, riboflavin, niacin, and folic acid) and iron that are added at federally specified levels. Nevertheless, the DGA recommend whole grains as important sources of under-consumed nutrients such as zinc, magnesium, and dietary fiber. They also cite evidence of a relationship between whole-grain consumption among adults and reduced risk of some chronic health problems. Among children and adolescents, there is evidence of a reduced risk of obesity in adolescence and of cardiovascular disease in adulthood, although the expert committee that advised the Federal Government on the DGA judged that evidence to be limited.
Researchers at USDA, Economic Research Service and the University of Georgia used national food consumption survey data collected between 1994 and 2018, the most recent year for which such data were available, to assess whole-grain intakes of U.S. consumers and how they have changed over time (See “Measuring Trends in Whole-Grain Intakes” below). The earliest DGA included general recommendations to eat whole-grain, fiber-rich foods, but the 2005 recommendations provided more specific advice. Recommended amounts were stated as “ounce equivalents”— the amount of whole grains found in a 1-ounce slice of whole-grain bread. Recommended consumption amounts are based on an individual’s caloric intake. For example, the recommendation for a 2,000-calorie diet is 6 ounce equivalents of grains, with at least half being whole grains. Because caloric needs vary by age, gender, and physical activity, the researchers used a density measure (whole-grain ounce equivalents per 1,000 calories) based on a 2,000-calorie daily intake, the reference standard used for the Nutrition Facts panel on food labels. This results in a benchmark standard of 1.5 ounce equivalents of whole grains per 1,000 calories.
Imbalance Between Refined Grain and Whole-Grain Consumption
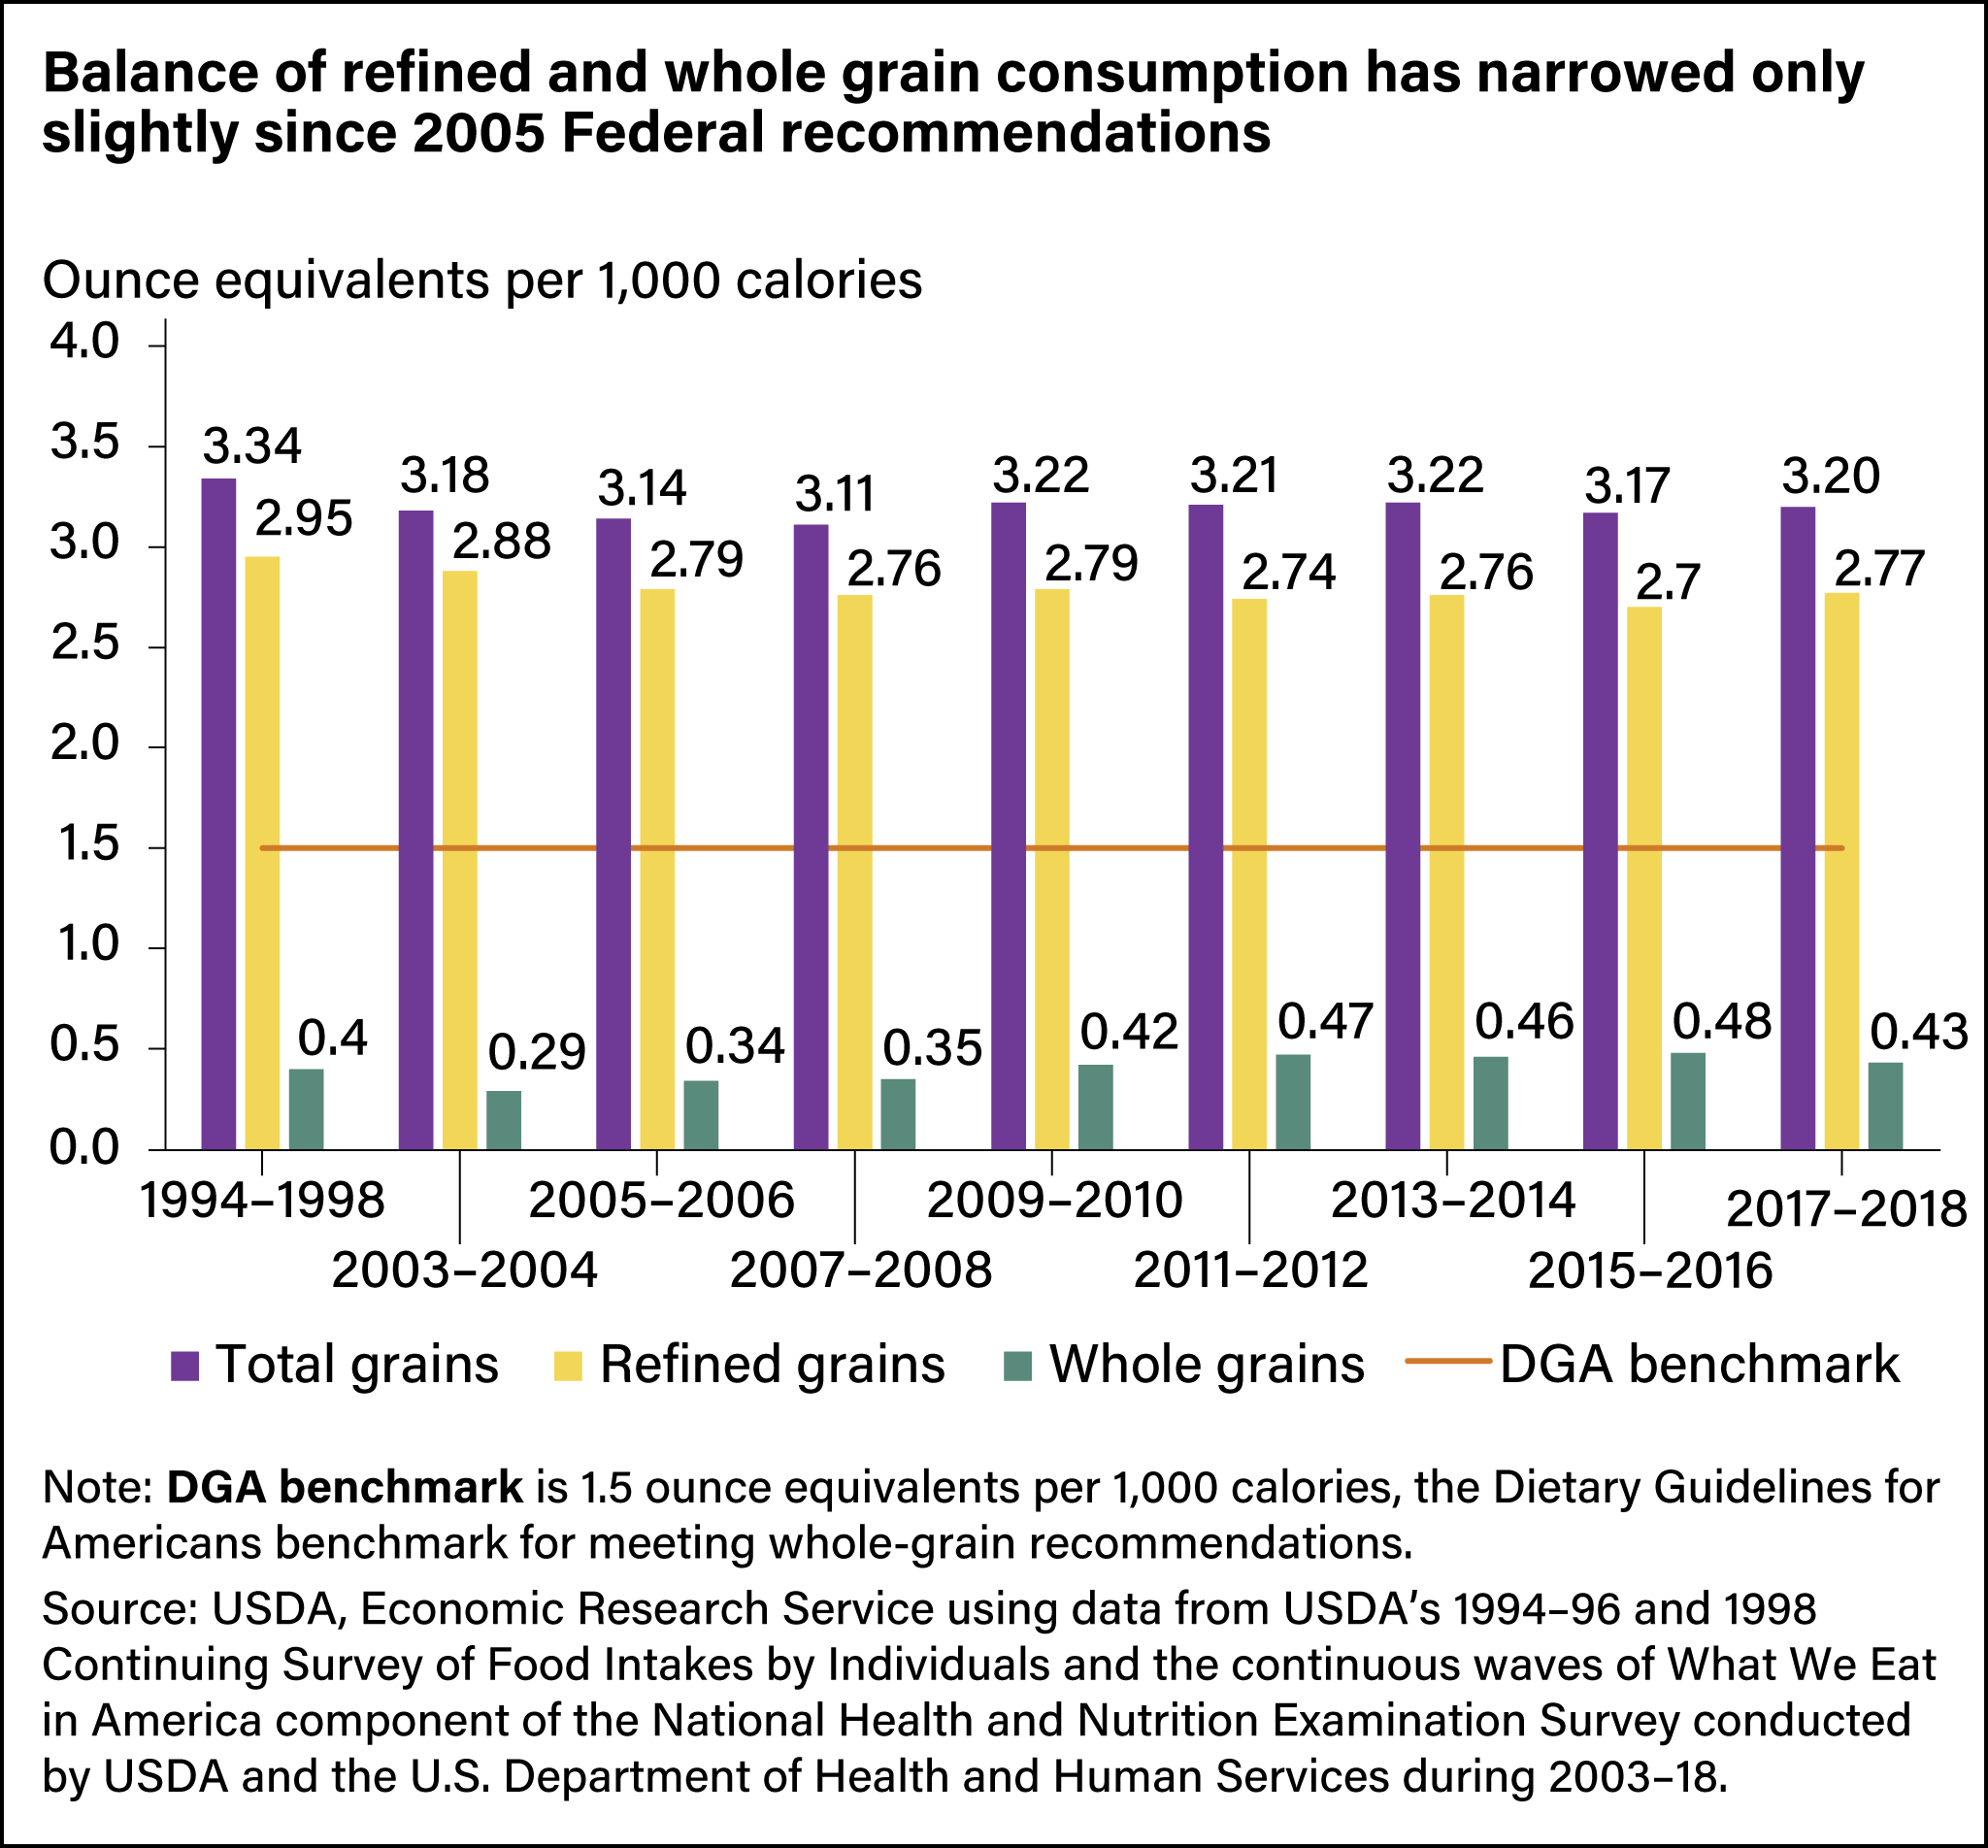
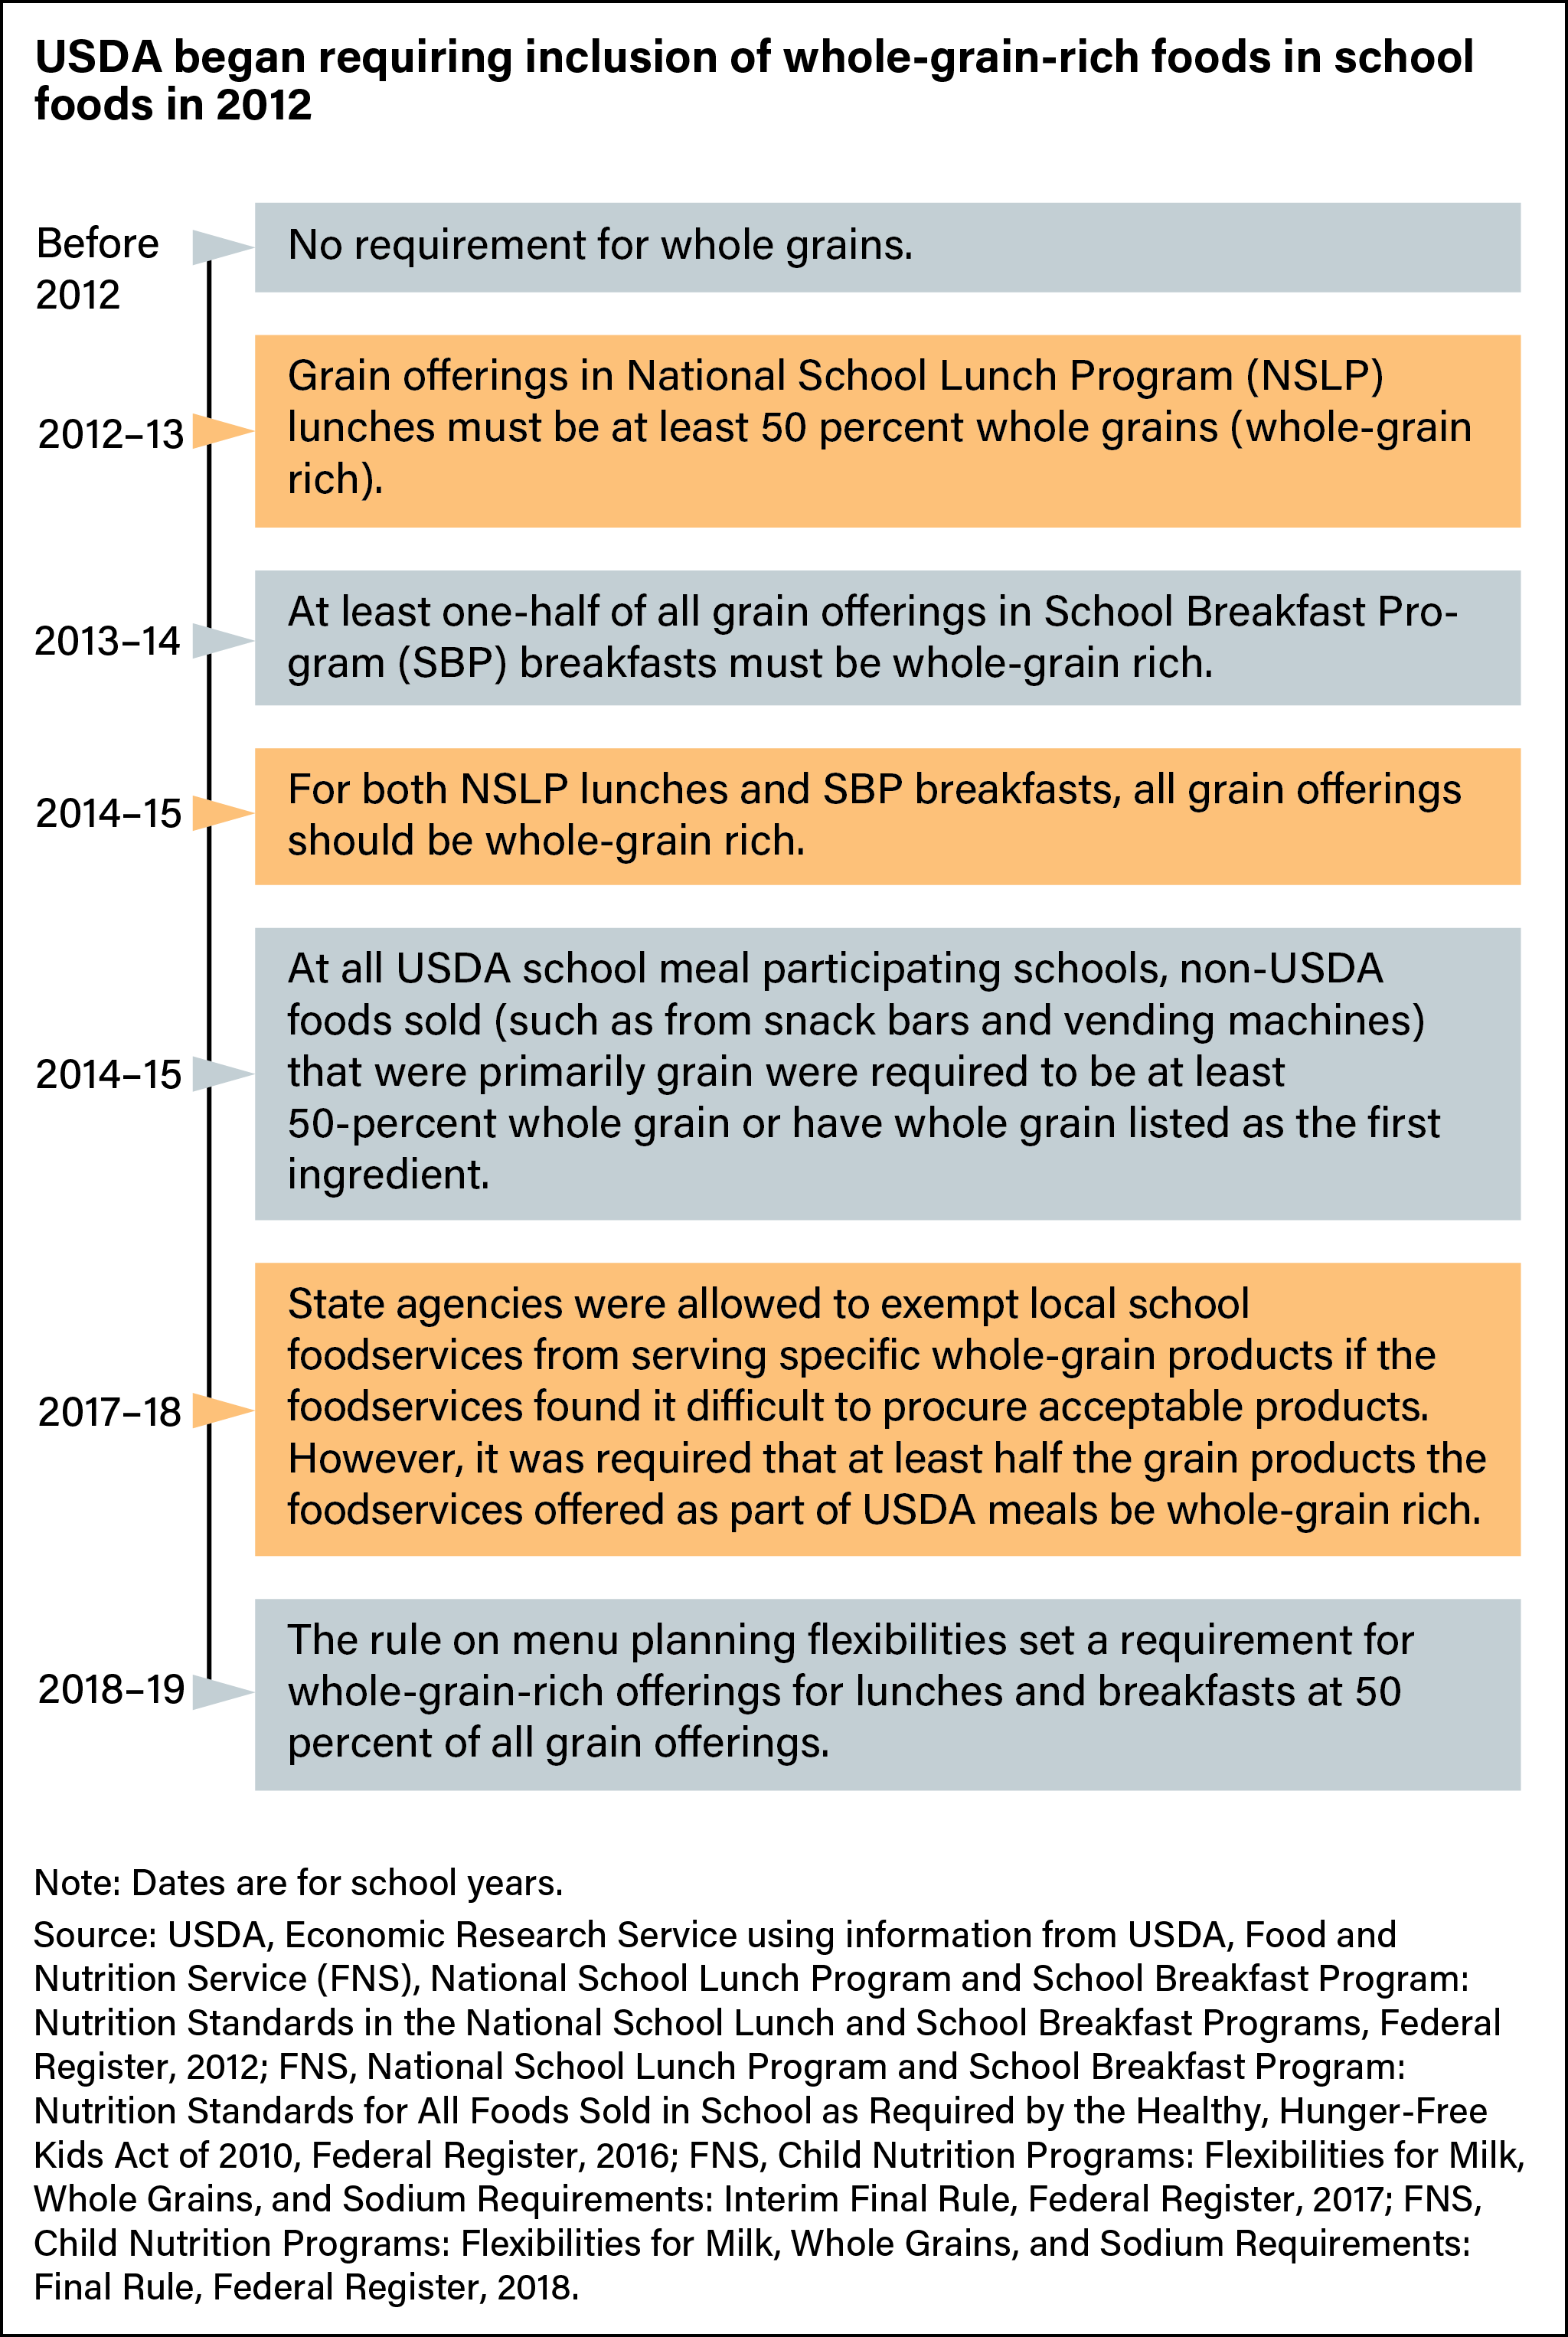
In 1994–98, total grain intake by U.S. residents 2 years old and over averaged 3.34 ounce equivalents per 1,000 calories, slightly above the benchmark of 3 ounce equivalents per 1,000 calories. Of this total, whole-grain intakes were 0.4 ounce equivalent per 1,000 calories, less than one-third the benchmark of 1.5 ounce equivalents. Refined grain intakes were roughly seven times higher. Public and private sector response to the 2005 DGA recommendation to balance whole- and refined-grain intakes included nutrition education and development or reformulation of products to include more whole grains. Notably, when Federal school nutrition policies were updated in 2012, meals served through the USDA National School Lunch (NSLP) and Breakfast (SBP) Programs were required to include foods rich in whole grains. New standards for snacks and other non-USDA foods sold at schools that participate in the NSLP also addressed whole-grain content.
Nevertheless, the disparity continued. Refined-grain intake was 2.77 ounce equivalents per 1,000 calories in 2017–18, while whole-grain intake was 0.43 ounce equivalents per 1,000 calories, essentially unchanged from 1994–98.
Older Adults Consumed the Most Whole-Grain Dense Diets, But Only Children’s Diets Saw an Increase
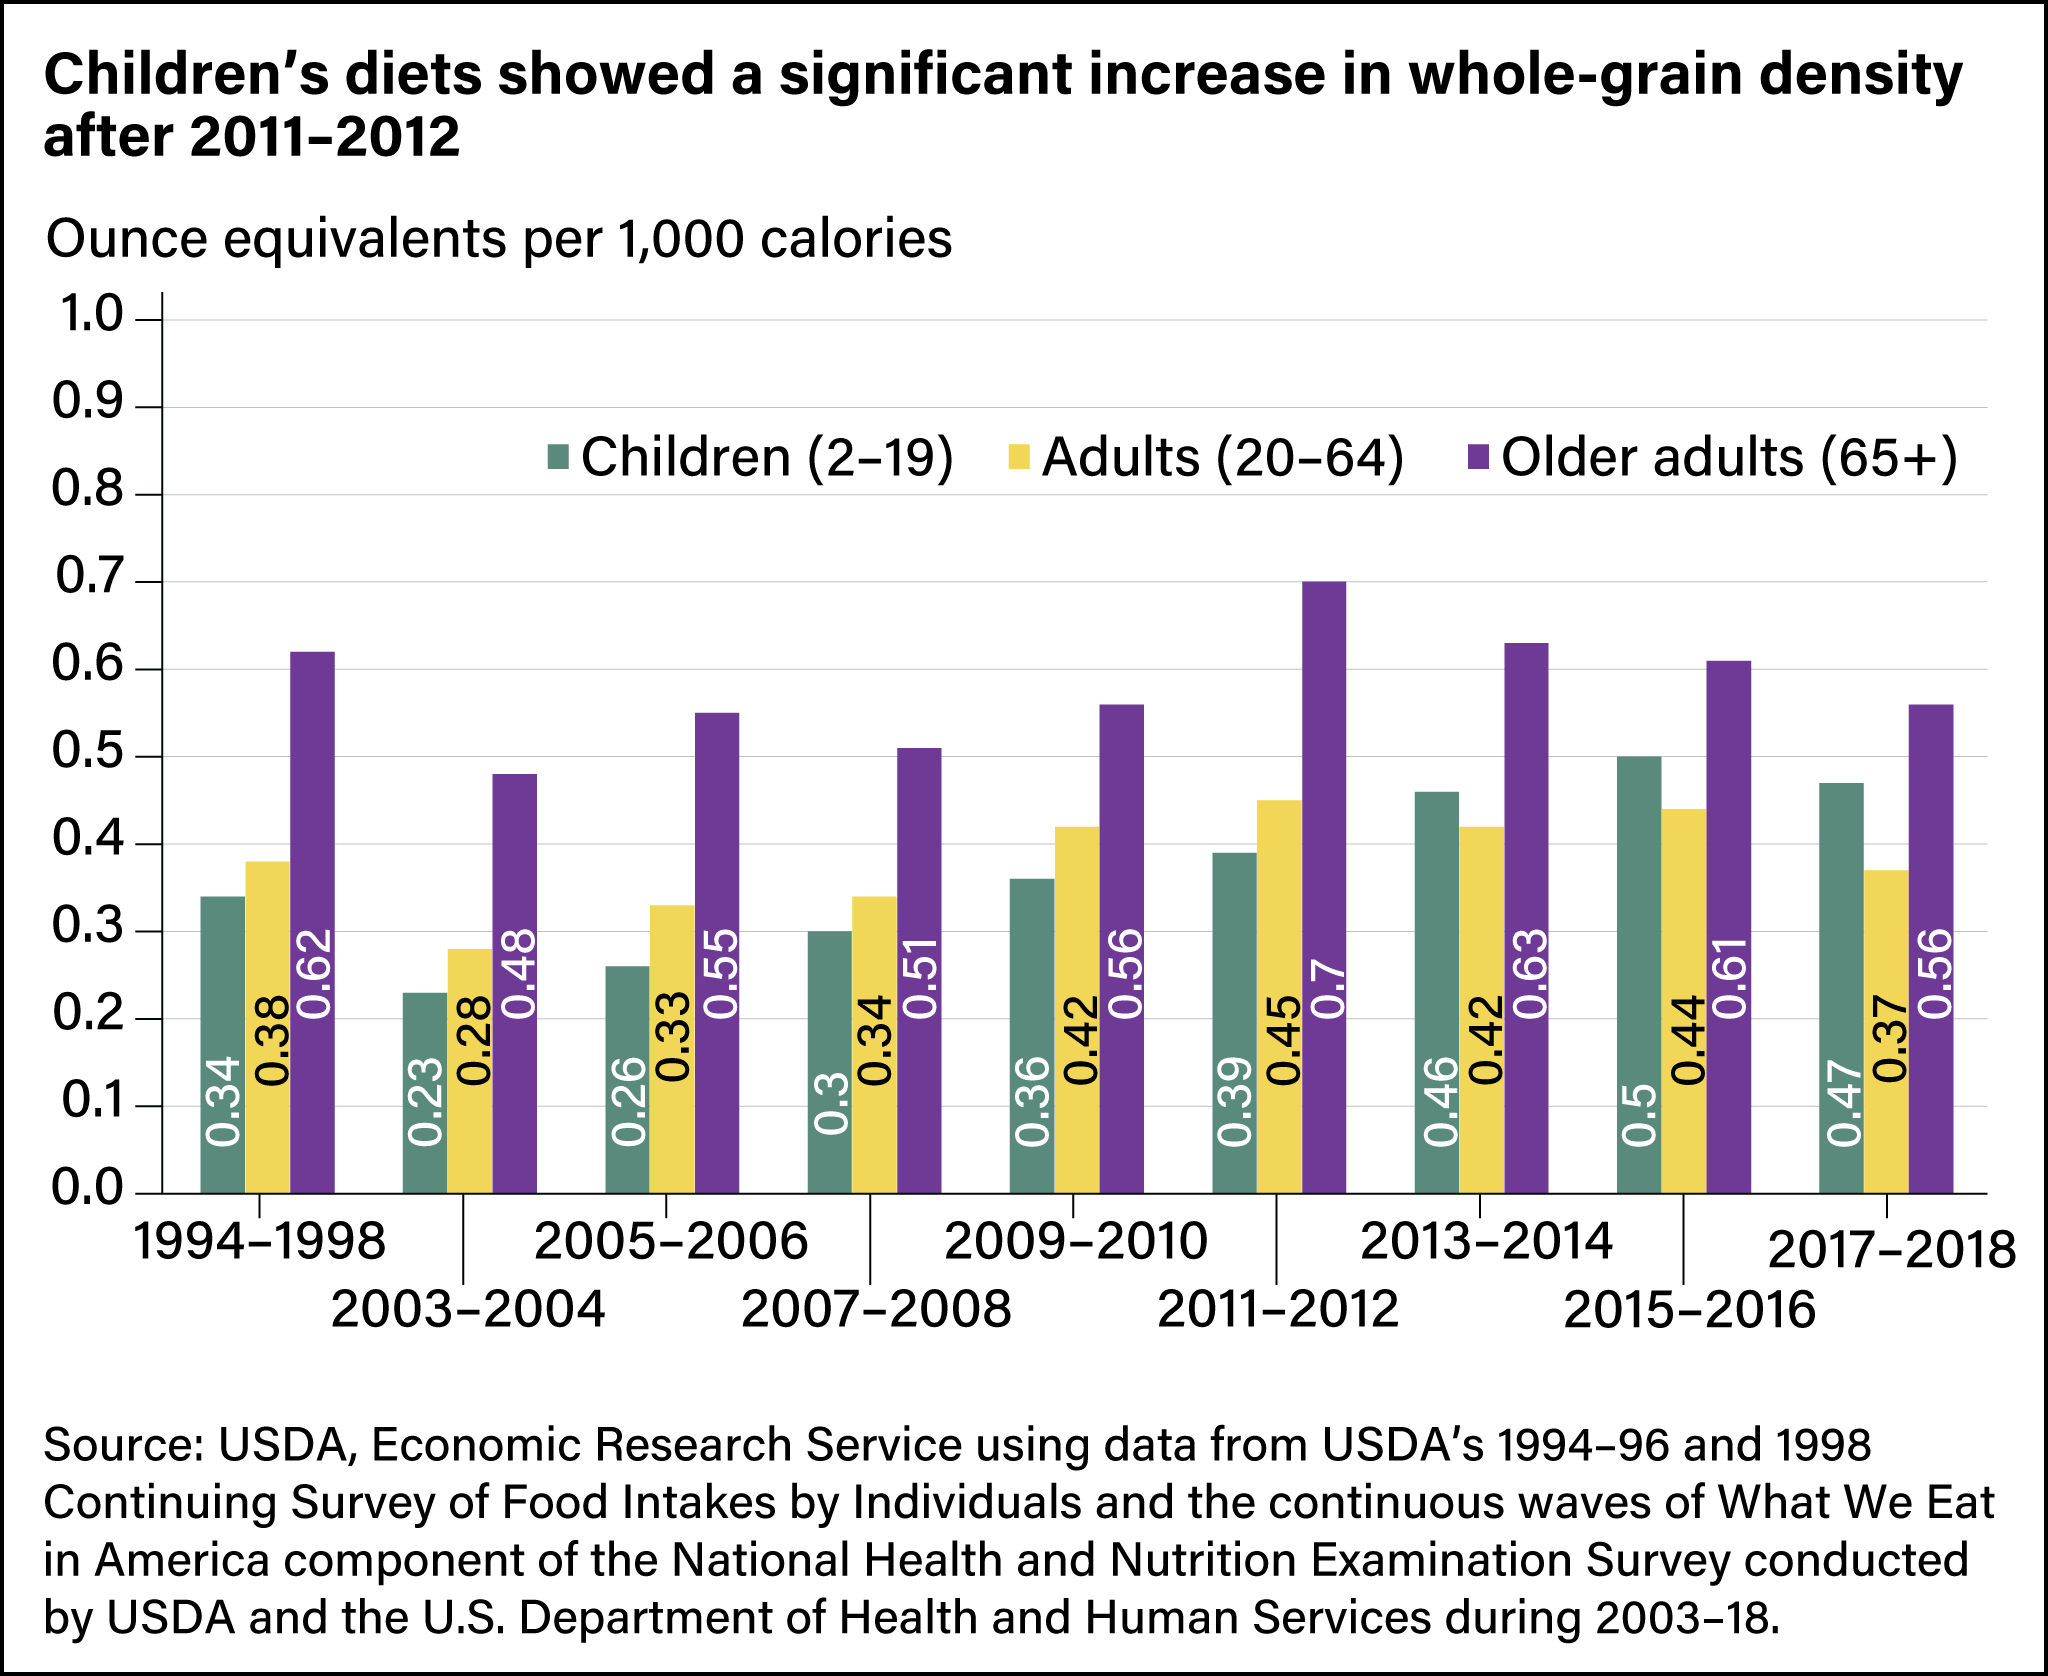
Compared with younger adults and children, older adults (65 years and above) consistently consumed more whole-grain dense diets. Even so, the whole-grain density of their diets was less than half the recommended level and was not significantly higher at the end of the period measured than it was at the beginning. Similarly, there was no significant difference in the whole-grain density of the diets of younger adults as of 2017–18 compared with 1994–98. Improvement occurred only among children. Starting in 2013–14, their diets were significantly more whole-grain dense than in earlier periods.
Whole-Grain Content of School Foods Increased
Throughout the time studied, food prepared at home was more whole-grain dense than food prepared away from home, at least taken as a whole. But when researchers looked deeper into food prepared away from home, they found a considerable difference between foods obtained at school and other sources of foods prepared away from home. The difference widened after 2012, when changes in the nutrition standards for USDA school meals and other foods sold at schools established whole-grain requirements.

After Change in Requirements, School Foods Played a Larger Role in Children’s Whole Grain Intake
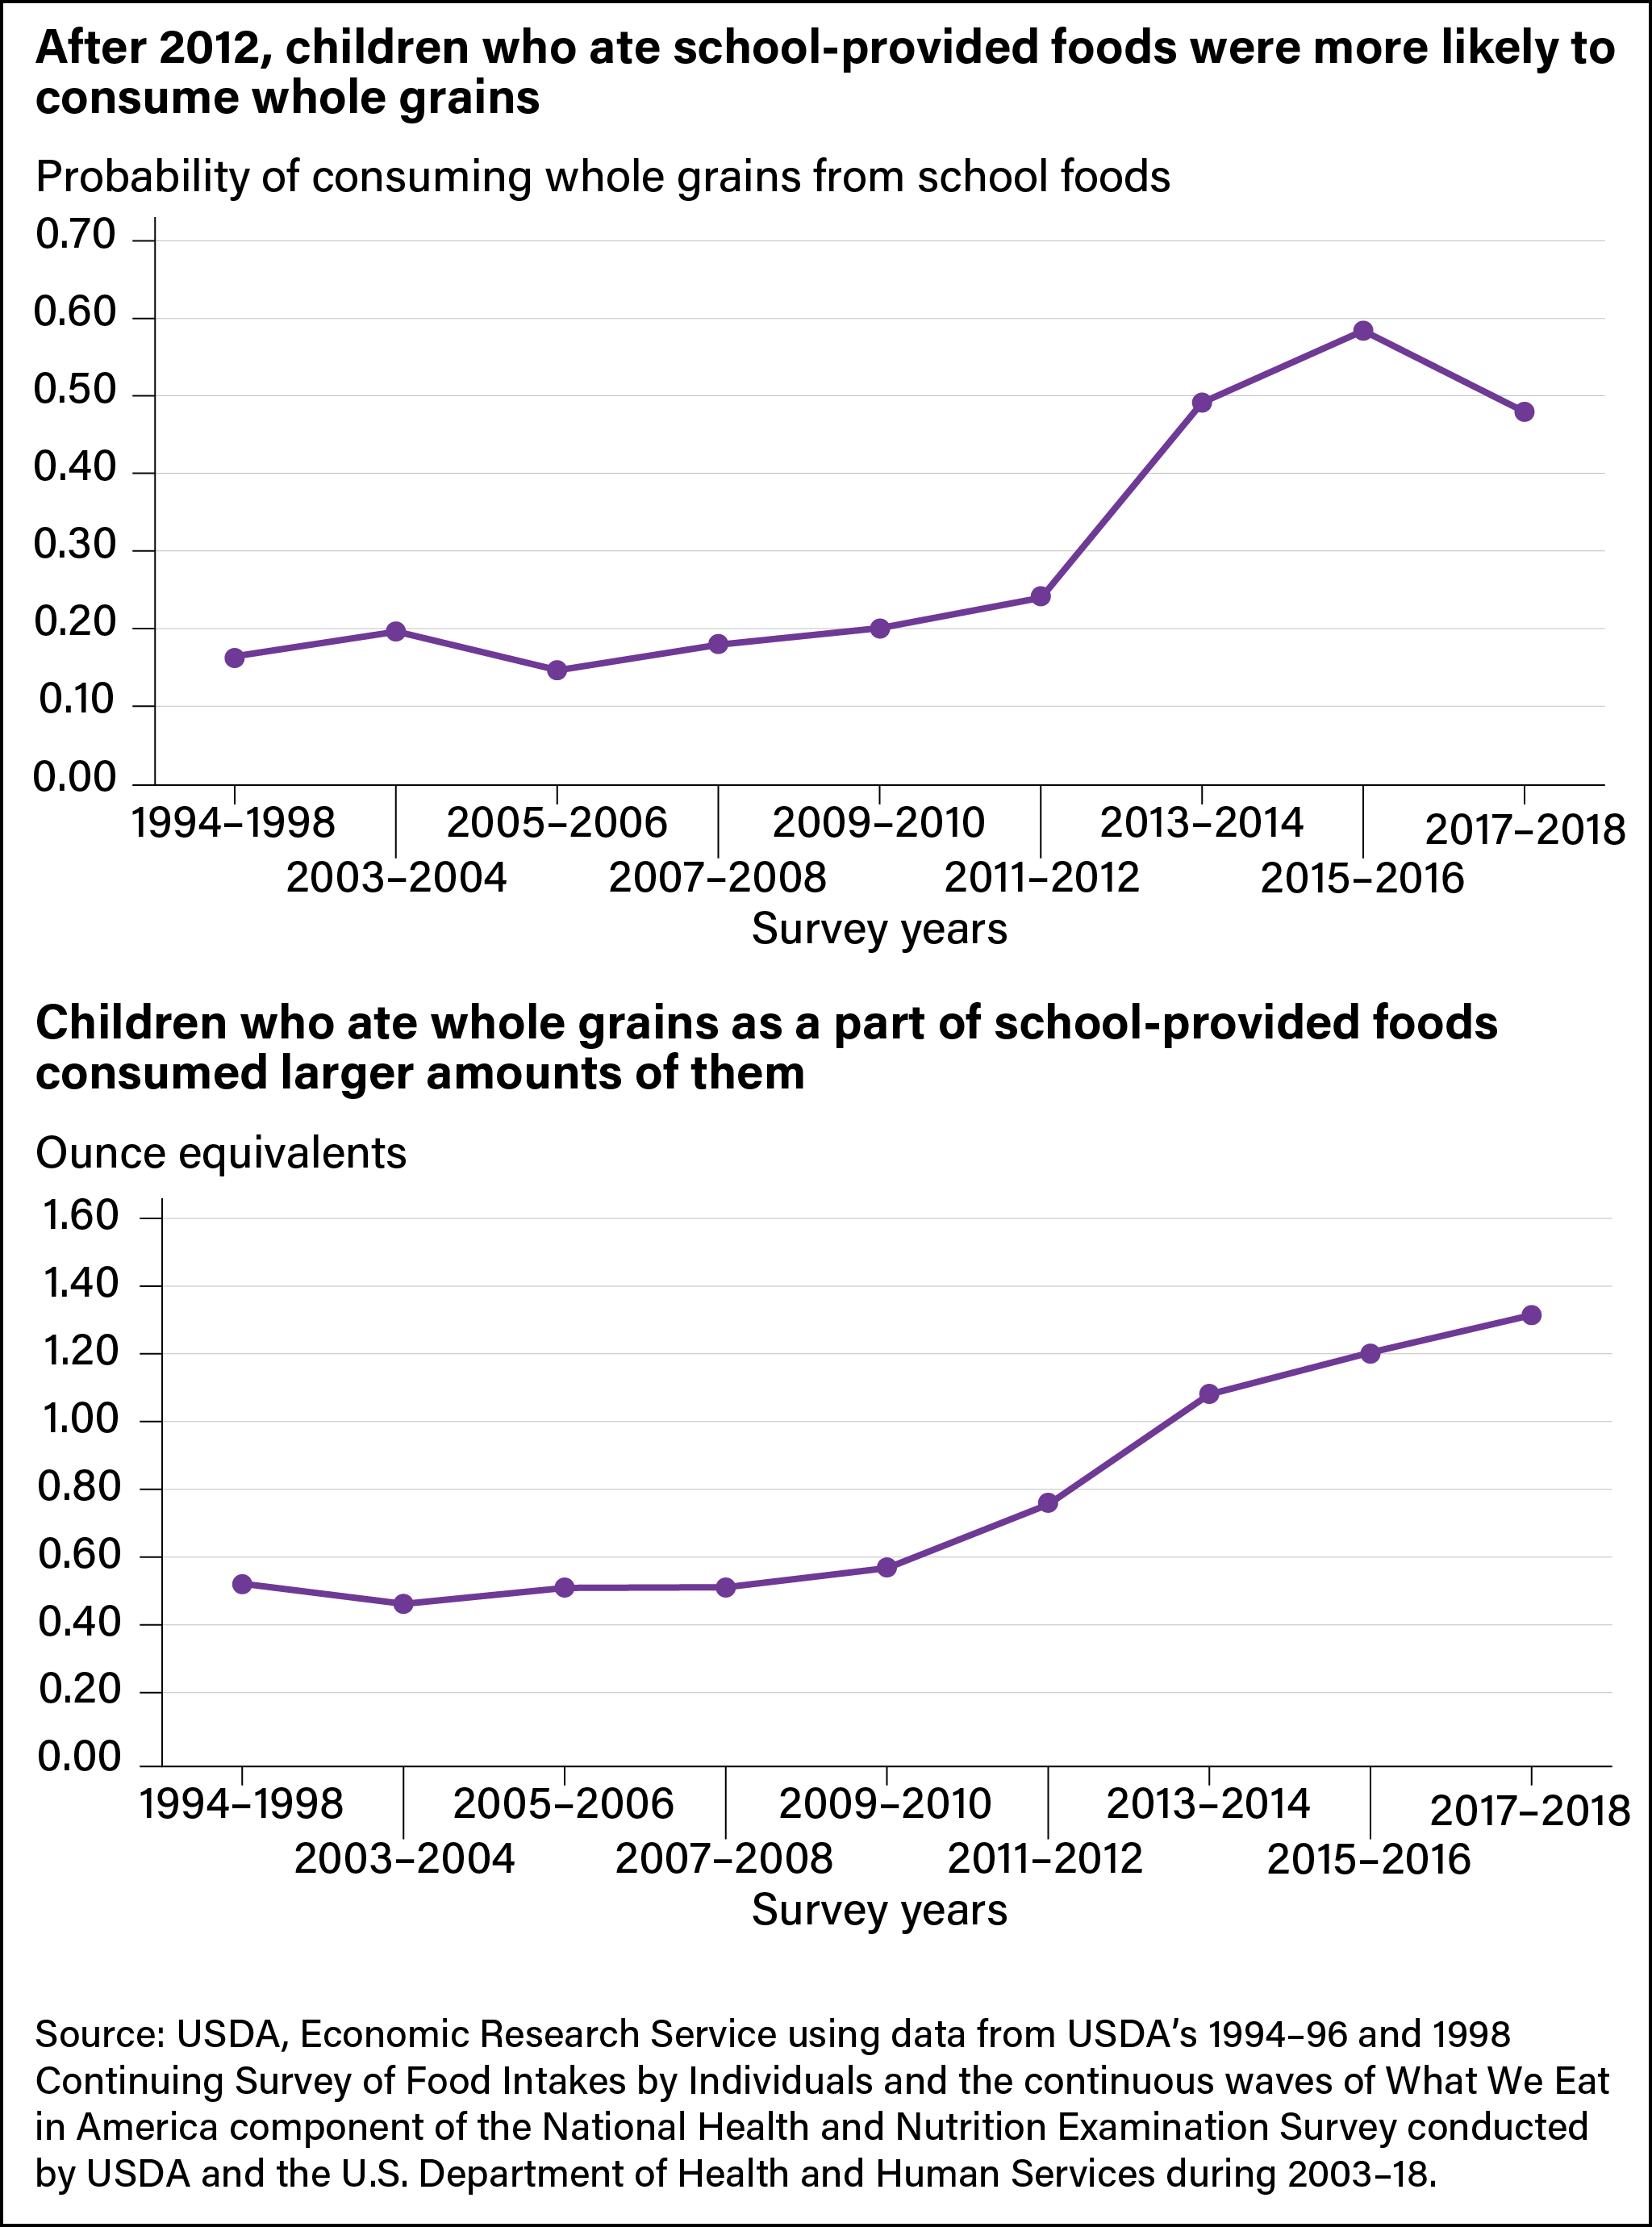
In this study, school foods are defined as foods obtained at school from USDA school meals or other foods, such as snacks, sold at school and not brought from home. The researchers first examined changes in the likelihood of children eating any whole grains from school food over the study period. They also examined changes in the amount of whole grains eaten from school food among those who ate any whole grain. For this analysis, amounts were expressed in terms of simple ounce equivalents, not per-calorie densities as in previous analyses. The child’s age, gender, race and ethnicity, household income, and education of the household head were controlled for in both analyses of the probability and amount of whole grains consumed. Before 2012, fewer than 1 in 4 children eating school foods consumed whole grains as a part of those foods. After 2013, children eating school foods were more than twice as likely to consume whole grains from school. The estimated likelihood of eating whole grains from school food ranged from 0.48 to 0.58 between 2013 and 2018—that is, when students ate school foods, approximately one in every two students ate whole grains from school foods.
Moreover, those who ate whole grains as a part of the foods they obtained at schools ate them in larger amounts. Among children who ate whole grains when eating food obtained at school, their whole grain intakes from school foods were significantly higher in 2013–18 than in 1994–2010, with the amount more than doubling from 0.51 ounce equivalent to 1.20 ounce equivalents.
Overall trends indicate grain intakes continue to be unbalanced, with more refined grains than recommended and fewer whole grains than recommended being consumed. Even so, children’s diets have shown improvement in whole-grain density after 2012. Changes in foods obtained at school coinciding with USDA’s requirement to include whole-grain-rich foods in school meals seem to have played an important role.
This article is drawn from:
- Lin, B., Smith, T.A. & Guthrie, J. (2023). Trends in U.S. Whole-Grain Intakes 1994–2018: The Roles of Age, Food Source, and School Food. U.S. Department of Agriculture, Economic Research Service. ERR-311.
You may also like:
- Guthrie, J., Lin, B. & Smith, T.A. (2020, February 3). Schoolchildren Consumed More Whole Grains Following Change in School Meal Standards. Amber Waves, U.S. Department of Agriculture, Economic Research Service.
- Guthrie, J., Lin, B. & Smith, T.A. (2016, June 6). Linking Federal Food Intake Surveys Provides a More Accurate Look at Eating Out Trends. Amber Waves, U.S. Department of Agriculture, Economic Research Service.
- Guthrie, J. (2021, May 3). USDA School Meals Support Food Security and Good Nutrition. Amber Waves, U.S. Department of Agriculture, Economic Research Service.
- Lin, B., Guthrie, J. & Smith, T. (2023). Dietary Quality by Food Source and Demographics in the United States, 1977–2018. U.S. Department of Agriculture, Economic Research Service. EIB-249.