U.S. Agricultural Trade Showed Resiliency Through COVID-19 Pandemic
- by Adam Gerval
- 7/20/2022
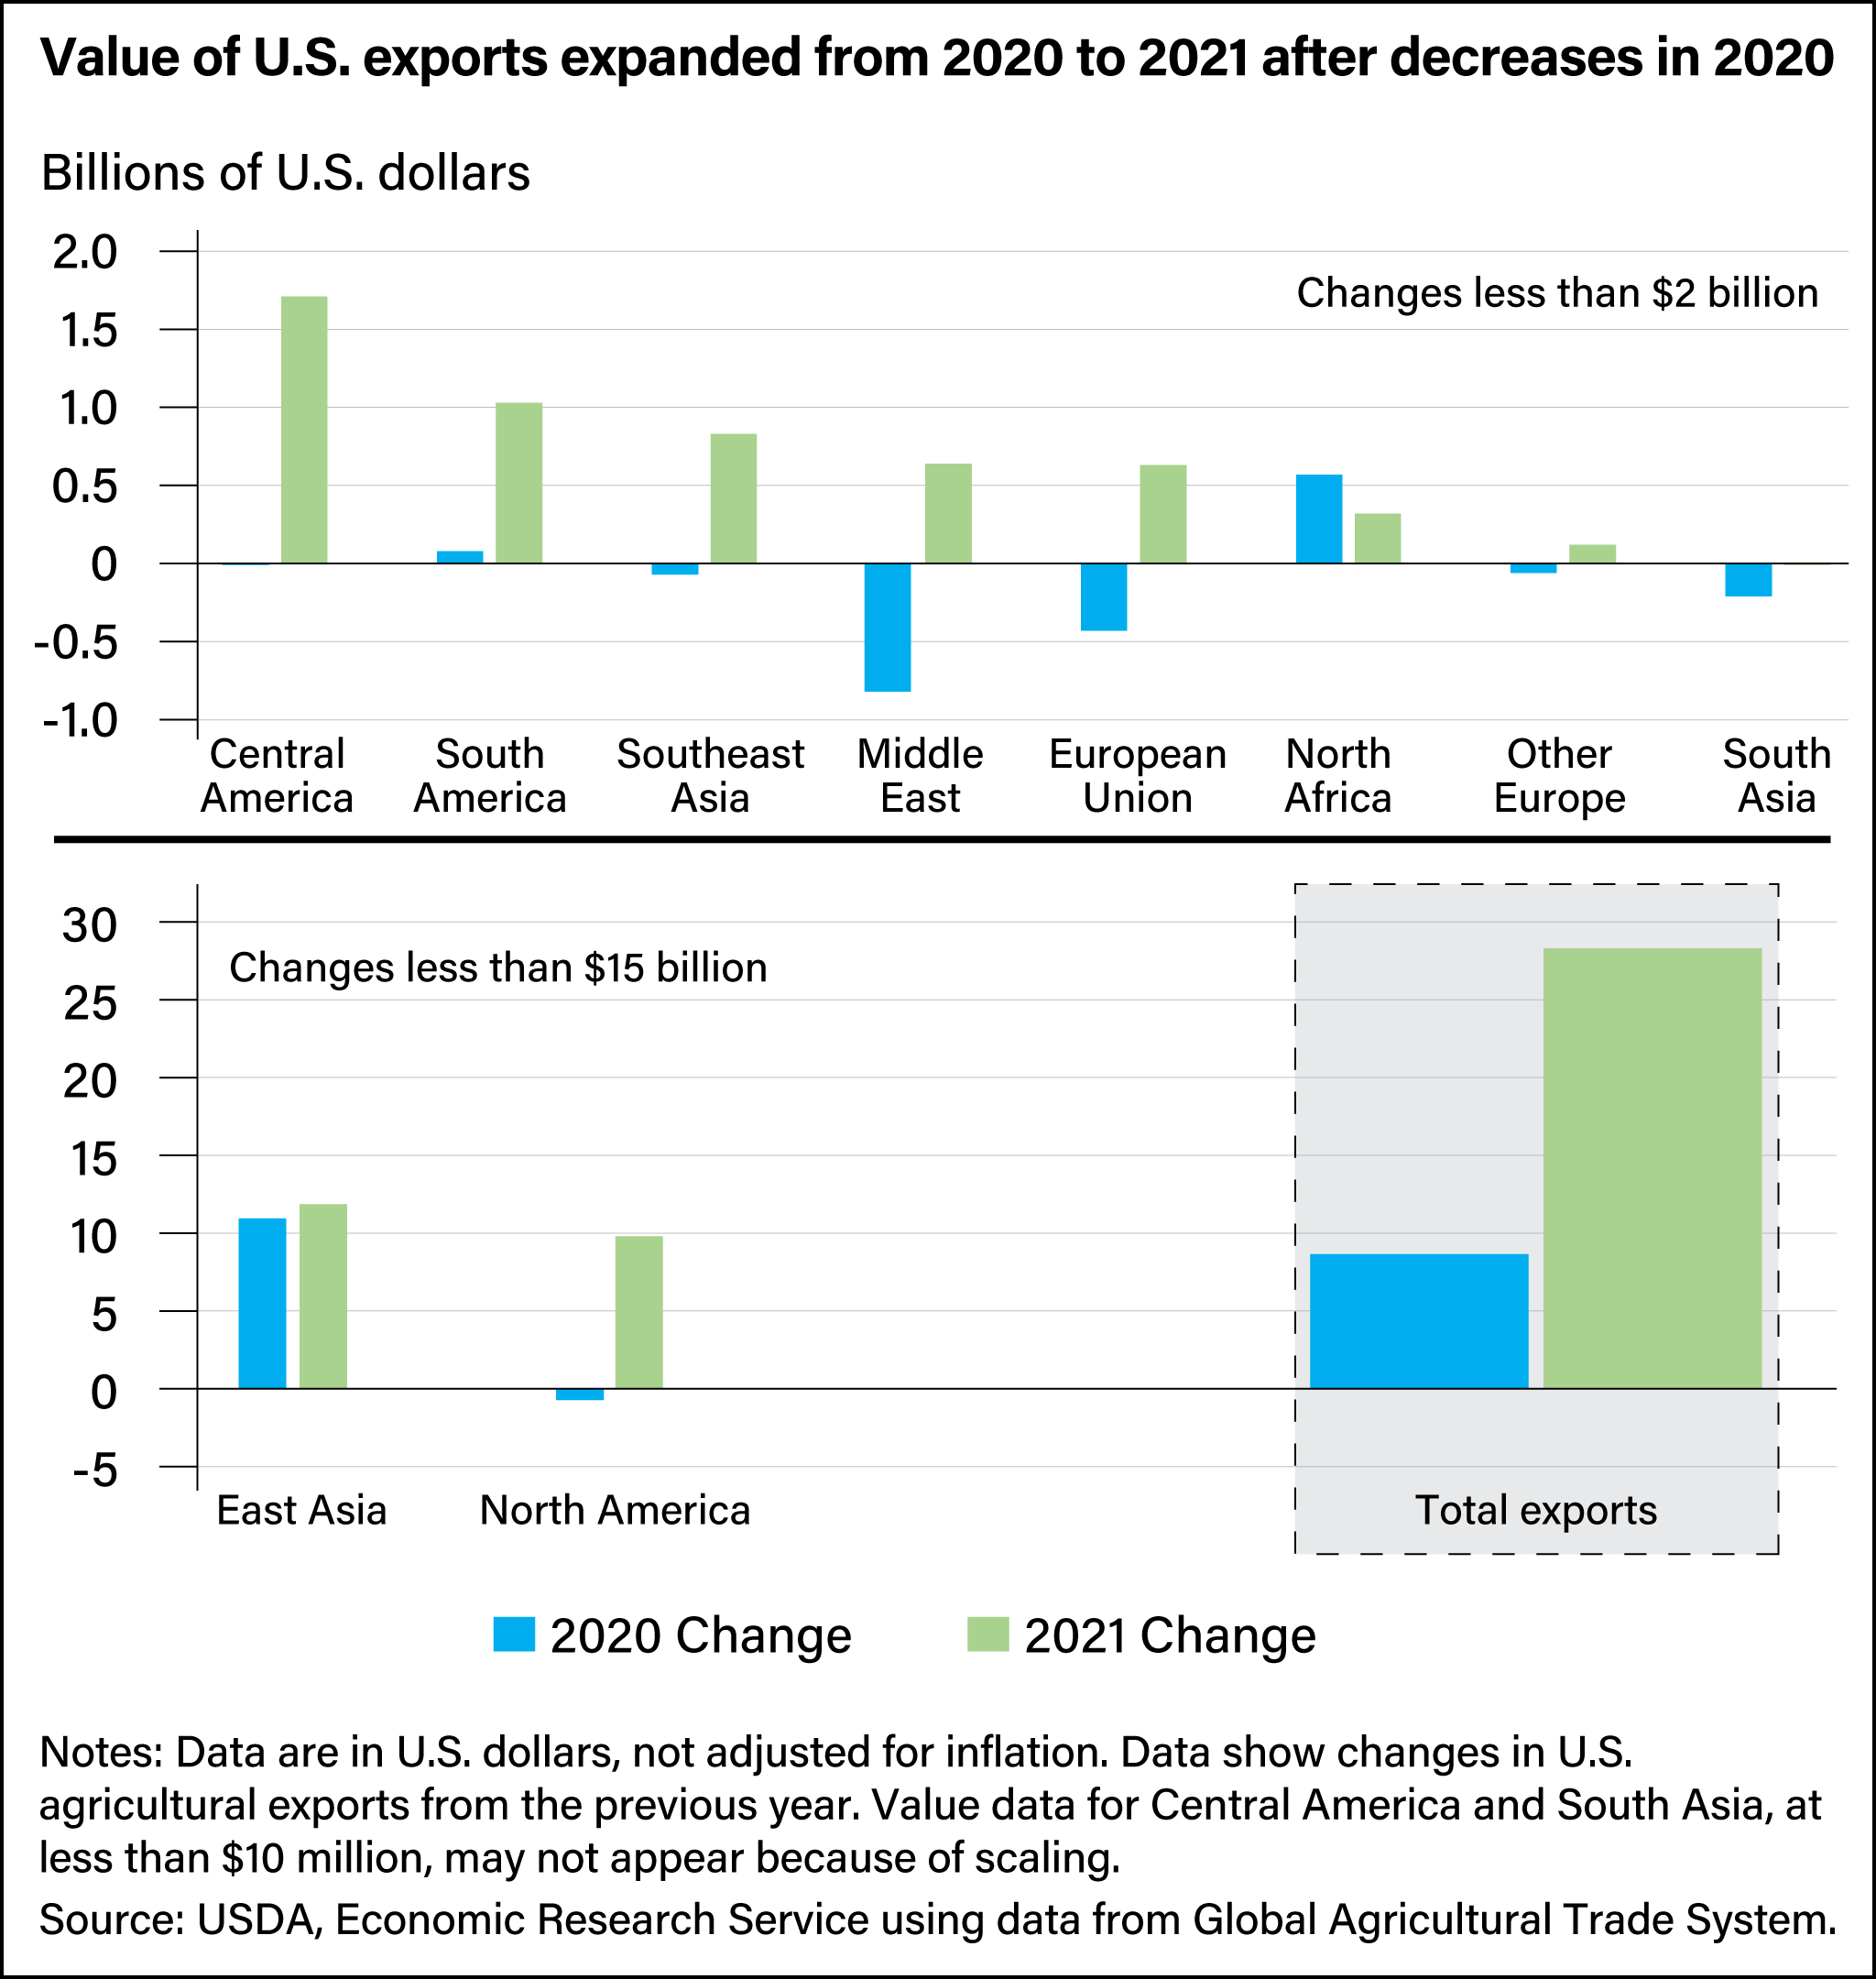
The overall value of U.S. agricultural trade increased in 2020 and 2021, despite global economic downturns from the Coronavirus (COVID-19) pandemic. In 2020, the United States exported $149.7 billion in agricultural exports, 6.1 percent more than the previous year and a 5-year high. The next year (2021), the value of U.S. agricultural exports rose an additional 18.9 percent to $177.0 billion. Soybean exports to China accounted for much of the increase in 2020, concentrated in the final 3 months of 2020 and offsetting declines in the value of many other U.S. agricultural exports in the early months of the pandemic.
Even with the net increase in agricultural exports in 2020, the value of U.S. exports declined in all but three regions—East Asia, South America, and North Africa. The high cost of shipping containers early in the pandemic weighed on overseas trading partners—such as the European Union (EU), South Asia, and Southeast Asia—who depend on maritime transport in international trade. In addition, a drop in oil prices limited demand in many oil-producing countries, primarily in the Middle East and Africa.
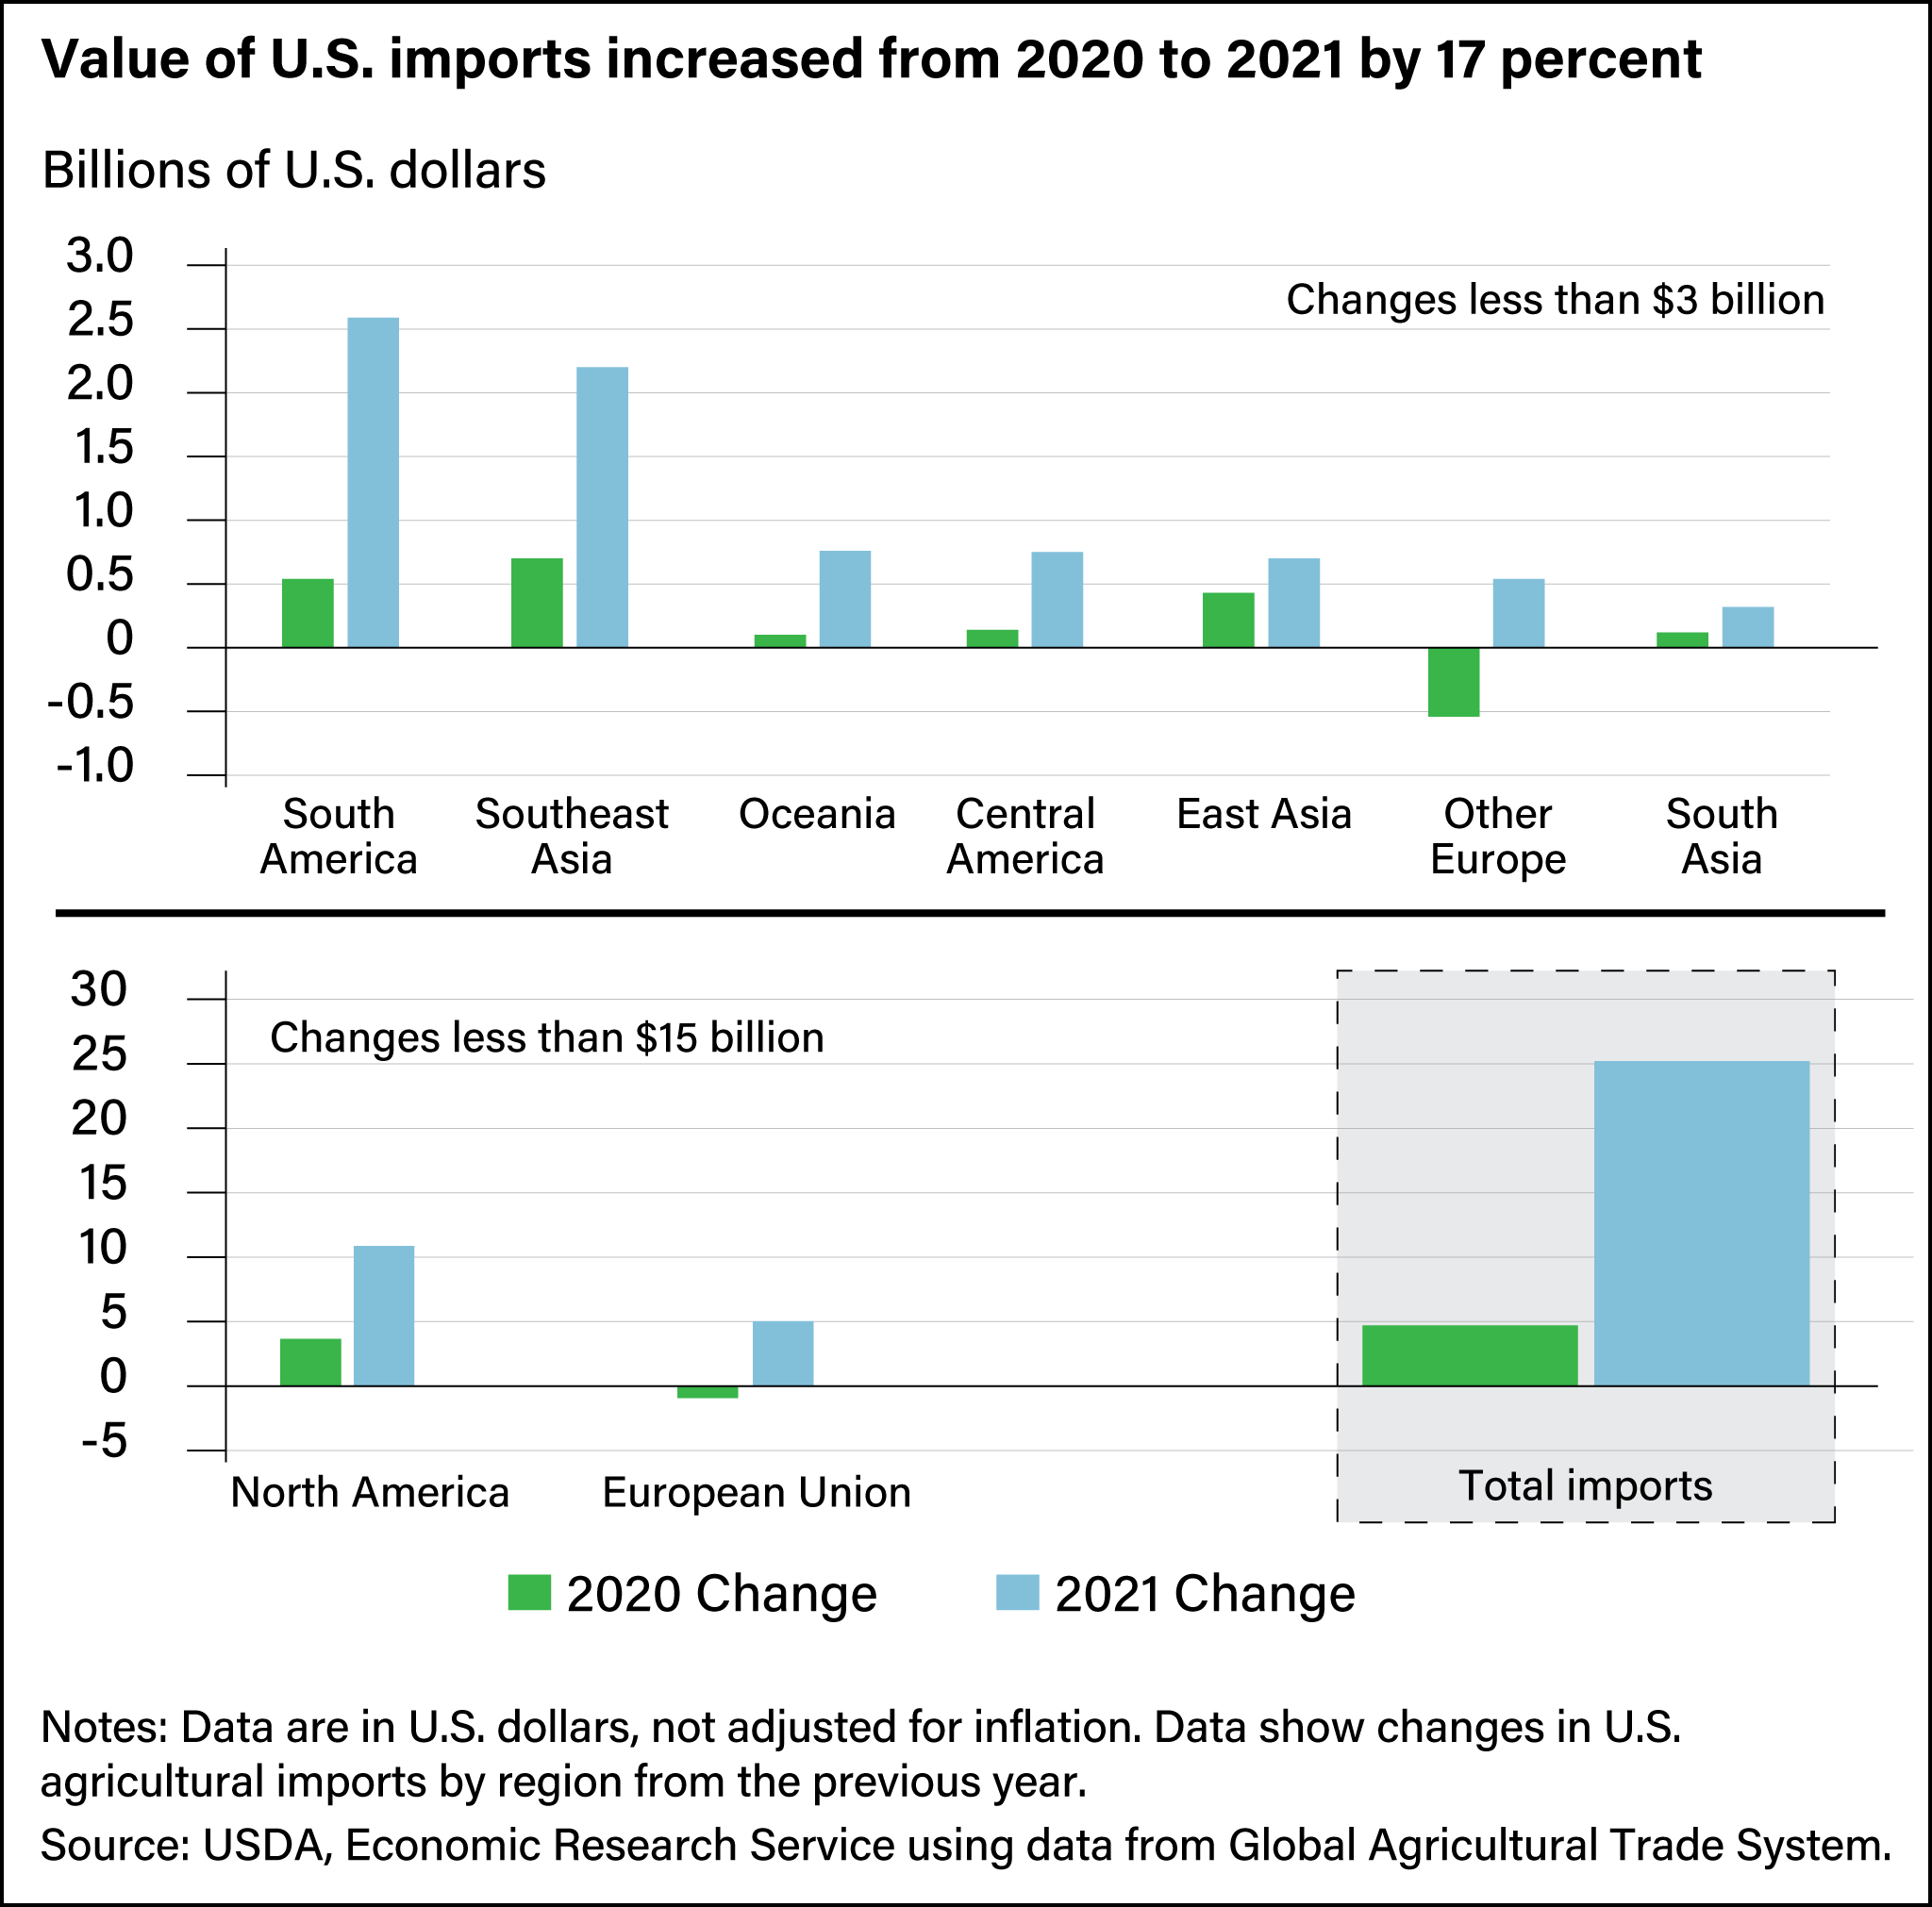
Conversely, imports from all but two regions (the EU and non-EU European countries) rose an average of 3.3 percent in 2020. Despite downturns early in the pandemic, the annual increase in imports from some regions, such as North and South America, was consistent with long-term trends seen before the pandemic. The decline in imports from the EU and other European countries was attributed to reduced imports of alcoholic beverages after the United States implemented a 25-percent tariff on imports of alcoholic beverages from the EU in 2019. Alcoholic beverages constitute the largest commodity group imported from Europe.
The value and share of U.S. exports of agricultural products to China continued to rebound and supported the export rise in 2021, similar to 2020. Growth in recent years follows a sharp drop-off during 2017–18 when a trade dispute between the United States and China resulted in retaliatory tariffs and a significant reduction in soybean exports. When the trade conflict was rectified, total U.S. soybean exports began to recover. In 2021, more than half of U.S. soybean exports were bound for China.
Growth in U.S. soybean exports to China is supported, in part, by increased feed demand as China’s hog herd expands after a period of losses from an African swine fever outbreak. U.S. corn exports to China rose from $55.5 million in 2019 to $5.1 billion in 2021, also fueled by higher demand for feed. In addition to surges in soybean and corn exports during the latter part of 2020, exports of other U.S. agricultural goods began to rebound, especially to North and Central American countries, as well as to sub-Saharan Africa.
As with exports, the value of U.S. imports trended higher in 2021, rising 17.2 percent from the previous year. The rate of increase in the value of imports from the United States’ North American partners, Canada and Mexico, more than doubled from the previous year, led by fruits, vegetables, and alcoholic beverages. Likewise, imports expanded for products from South and Central America, including fresh fruit, coffee products, nursery products, and sugar and sweetener products. Imports also rose for miscellaneous food and beverage products from Southeast Asia. In addition, imports from the EU rebounded to pre-COVID trading levels in 2021 on the strength of renewed imports of alcoholic beverages, which were up more than 18 percent from 2020.
While it is impossible to predict the course of COVID-19’s impact on the global economy and agricultural trade, empirical data provide evidence of a sustained recovery in agricultural trade, according to USDA, Economic Research Service. The value of U.S. agricultural exports is expected to grow at an annual rate averaging 0.8 percent per year from 2021 through 2031. The value of imports is projected to increase by an average annual rate of 6 percent over that period, based on projections for domestic consumer spending. Other major agricultural exporters have likewise shown resilience in the face of the COVID-19 pandemic, suggesting that the recovery to agricultural trade from the pandemic is widespread.
This article is drawn from:
- Dohlman, E., Hansen, J. & Boussios, D. (2022). USDA Agricultural Projections to 2031. U.S. Department of Agriculture, Economic Research Service. OCE-2022-01.
You may also like:
- Zahniser, S. (2022). COVID-19 Working Paper: U.S.-Mexico Agricultural Trade in 2020. U.S. Department of Agriculture, Economic Research Service. AP-97.
- Kenner, B., Jiang, H., Russell, D., Zeng, W., Zahniser, S., Ivanic, M., Dong, F., Husby, M. & Pham, X. (2022). Outlook for U.S. Agricultural Trade: February 2022. U.S. Department of Agriculture, Economic Research Service. AES-119.


