

Oil Booms Can Reduce Lifetime Earnings and Delay Retirement
- by Justin B. Winikoff
- 10/4/2021
Most research on the long-run costs and benefits of oil booms and busts has focused on economic indicators such as total income or employment in energy-production regions rather than on the effects at the individual or household level. New research by USDA, Economic Research Service (ERS), the University of Oregon, and the University of Wisconsin-Madison used annual household-level survey data from the Panel Study of Income Dynamics to estimate the cumulative effects of oil production booms and busts on households in those regions.
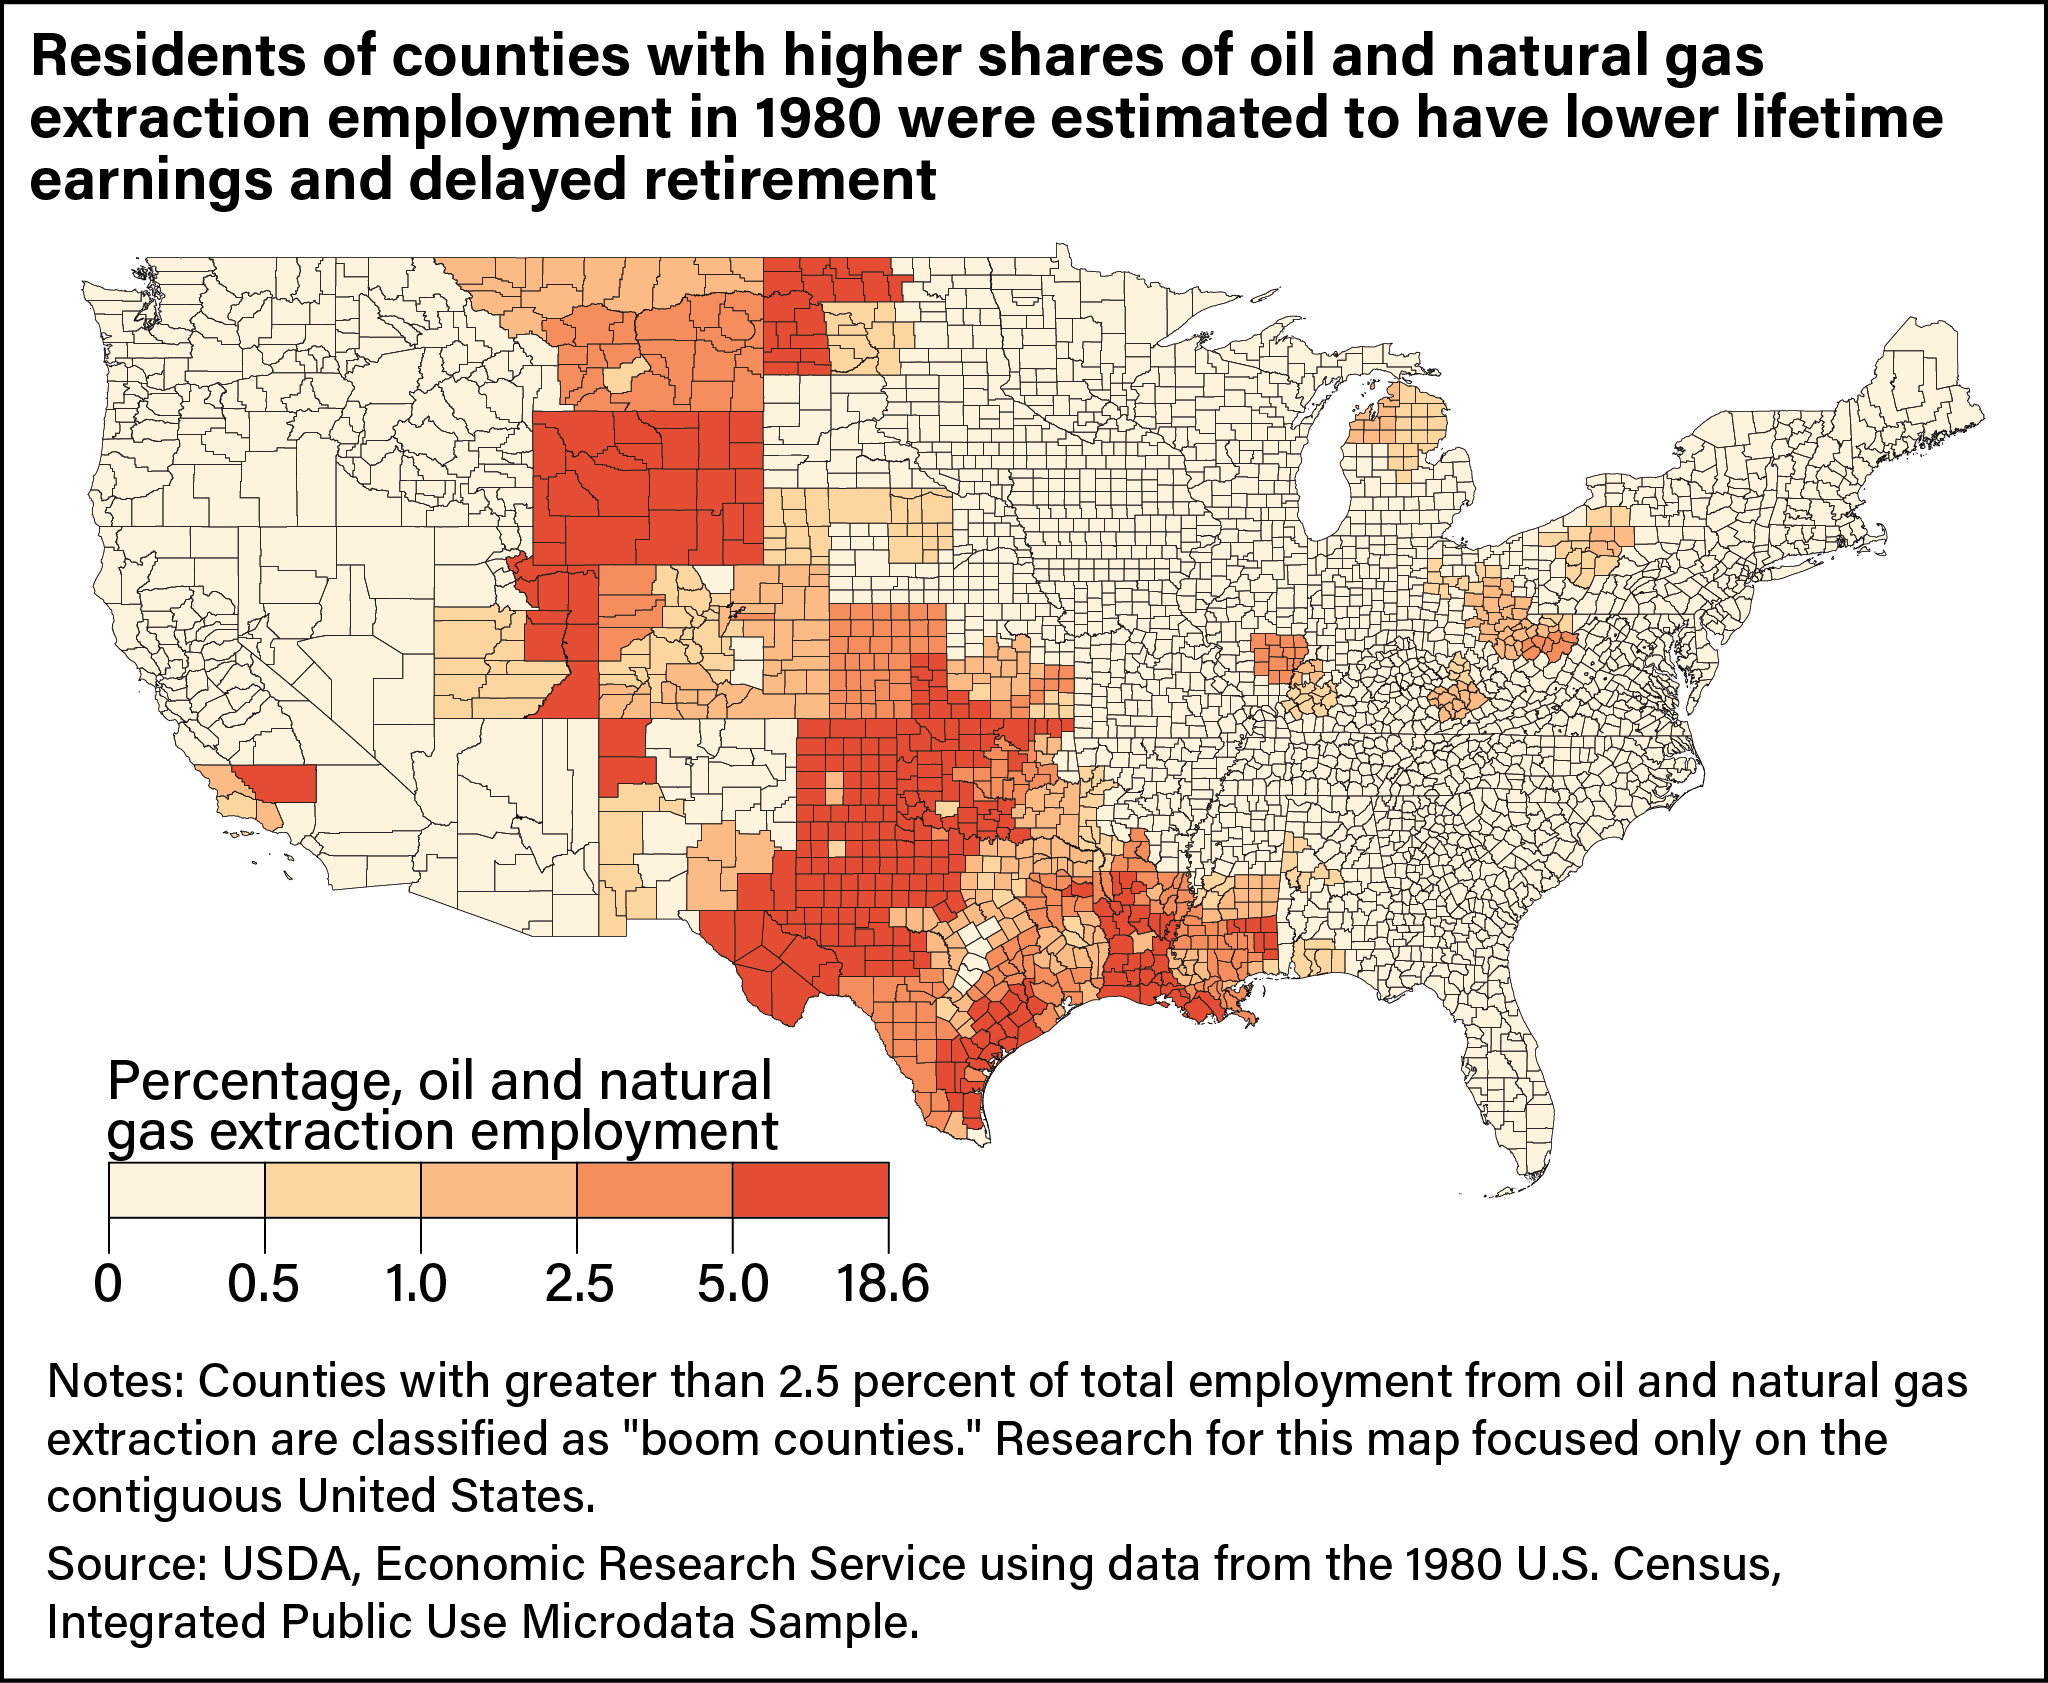
The research focuses on the rapid rise and decline of oil production in the 1970s and 1980s. The goal was to study long-term effects of such a boom-and-bust cycle on households in the following decades. An ERS researcher and co-authors classified “boom households” as those living in one of the 489 counties with significant employment in oil and gas extractive industries during 1980, the peak of the oil boom. The researchers used a statistical model to estimate the cumulative effects of the oil boom and bust on the earnings and retirement decisions of residents who were present before the unexpected oil boom.
Although incomes rose for both boom and non-boom households during the oil boom, they increased by an average of about $5,000 more annually for boom households during the early boom (1975–79) and $6,900 more each year during the late boom (1980–84) compared with similar households in counties that were not producing oil. The subsequent bust, however, saw incomes rise by an average of $8,000 less annually from 1985 to 1992 for households in boom counties compared with households in non-boom counties. The lower average household gains were driven in part by increased unemployment and the dissipation of relative wage gains during the boom. The oil boom and bust appeared to have no effect on relative changes in household income after 1993. Aggregating across all years, cumulative income for the average household in a boom county was $7,600 lower than for an average household in an otherwise similar non-boom county between 1975, the beginning of the boom, and 2012, the final year of the study.
The study found that the lower average income gains among boom-county households were driven by homes with heads of household in the prime working ages of 25–54. Households with heads age 55 and older in boom counties did not experience net lower income over the time period compared with older heads in non-boom counties. To understand why, the researchers examined the decision to retire for household heads in this age group. They found that boom household heads were about 15 percent less likely to retire from 1989 to 1992. Because these workers remained in the labor force while their peers in non-boom counties were retiring and not earning wages, their relative incomes were higher. Because of wealth reductions during the bust, households likely remained in the labor force to recoup their losses.
Quantifying income gains and losses is essential to understanding the welfare effects of energy production. This research suggests households may be forced to respond to volatile economic conditions in costly ways, including forgoing retirement. Although cumulative earnings may be higher for households whose wage earners remain in the labor force, the volatility of the boom and bust may actually impair the welfare of those who are compelled to make otherwise undesirable decisions.
Errata: On October 25, 2021, the map accompanying this finding was revised to show the correct number of counties in the contiguous United States.
This article is drawn from:
- Jacobsen, G., Parker, D. & Winikoff, J. (2021). Are Resource Booms a Blessing or a Curse? Evidence From People (Not Places). Journal of Human Resources.
You may also like:
- Hitaj, C. (2016, November 7). Share of Farm Businesses Receiving Lease and Royalty Income From Energy Production Varies Across Regions. Amber Waves, U.S. Department of Agriculture, Economic Research Service.
- Hitaj, C. (2017, February 6). Energy Consumption and Production in Agriculture. Amber Waves, U.S. Department of Agriculture, Economic Research Service.
- Hitaj, C. (2018, July 2). Farm Operators Owned $19.1 Billion in Oil and Gas Rights, Which Generated $3.8 Billion in Payments in 2014. Amber Waves, U.S. Department of Agriculture, Economic Research Service.
- Hitaj, C., Weber, J.G. & Erickson, K. (2018). Ownership of Oil and Gas Rights: Implications for U.S. Farm Income and Wealth. U.S. Department of Agriculture, Economic Research Service. EIB-193.
- Hitaj, C. & Suttles, S. (2016). Trends in U.S. Agriculture's Consumption and Production of Energy: Renewable Power, Shale Energy, and Cellulosic Biomass. U.S. Department of Agriculture, Economic Research Service. EIB-159.