China’s Safety Requirements Pose Challenge for Food Exporters
- by Fred Gale
- 5/3/2021
Highlights
- China food safety requirements can cause food shipments to be turned away at the China border.
- Processed, consumer-ready foods and beverages such as wine top the list of items that have not met the requirements of Chinese inspectors.
- China’s food imports rose 12 percent from 2006 to 2019 as demand for a variety of foods increased.
- The number of rejected shipments has declined for exporters from the United States and European Union, but China has increased its scrutiny of food coming from less-developed nations such as Vietnam, India, and Thailand.
Imported foods such as seafood, meat, processed foods, and beverages are becoming more common on China’s supermarket shelves and restaurant tables, creating opportunities for exporters around the world. However, selling these products to China also presents challenges as exporters must comply with standards and food safety regulations that Chinese leaders have called “the strictest ever.”
Over the past two decades, China has imposed numerous new food-related laws and standards, mostly to address its own problems with food safety and fraud. Imported food also must meet these requirements, some of which are unique to China. Exporters of certain foods like meat and dairy must pass audits and register with Chinese authorities. Foods sold in China must bear labels in Chinese script with contact information for suppliers; certain words and phrases are banned. Some product standards specify which nutritional content and allowable additives and dyes are allowed in the country.
Customs officials inspect and test food shipments to ensure exporters comply with these requirements. Between 2006 and 2019, officials reported rejecting an average of 2,600 food shipments per year from all countries. The overall risk of food shipment rejections is not high—less than 0.5 percent of shipments are rejected in most years—but the cost of gaining access to the market and the fallout from violations of China’s numerous laws, regulations, and standards can be considerable. Shipments encountering scrutiny of inspectors could be held in storage for extended periods, destroyed, or diverted to alternate countries at discount prices.
USDA’s Economic Research Service (ERS) sought to better understand how Chinese food safety requirements affect imported foods by examining the lists of rejected food shipments reported monthly by China’s customs authority. ERS compiled and analyzed nearly 38,000 rejections from more than 100 countries reported over 15 years to identify trends and characterize the types of foods China rejects, the problems cited, and which countries have the most products rejected.
In 2020, China refused entry to 99 U.S. food shipments—down from 136 per year in 2018-19. The rejected products included meat, seafood, beer, drink mixes, canned noodles, infant food, raisins, prunes, almonds, honey, candy, and nutritional supplements. China’s inspectors cited a variety of problems such as lack of documentation, degradation of products, mildew, high bacterial counts, excessive moisture, and presence of foreign material. They turned away products of prominent U.S. food manufacturers, as well as those of small companies.
Food exporters from the United States and European Union (EU) have seen a decline in the number of shipments refused at the China border, possibly reflecting improved compliance from those nations. Another factor may be that Chinese inspectors have shifted attention to shipments from less developed countries, such as Vietnam, India, Ecuador, and Russia, indicating exporters from those nations are likely to encounter challenges in meeting China’s requirements.
Number of Food Import Rejections Varies Widely From Year to Year
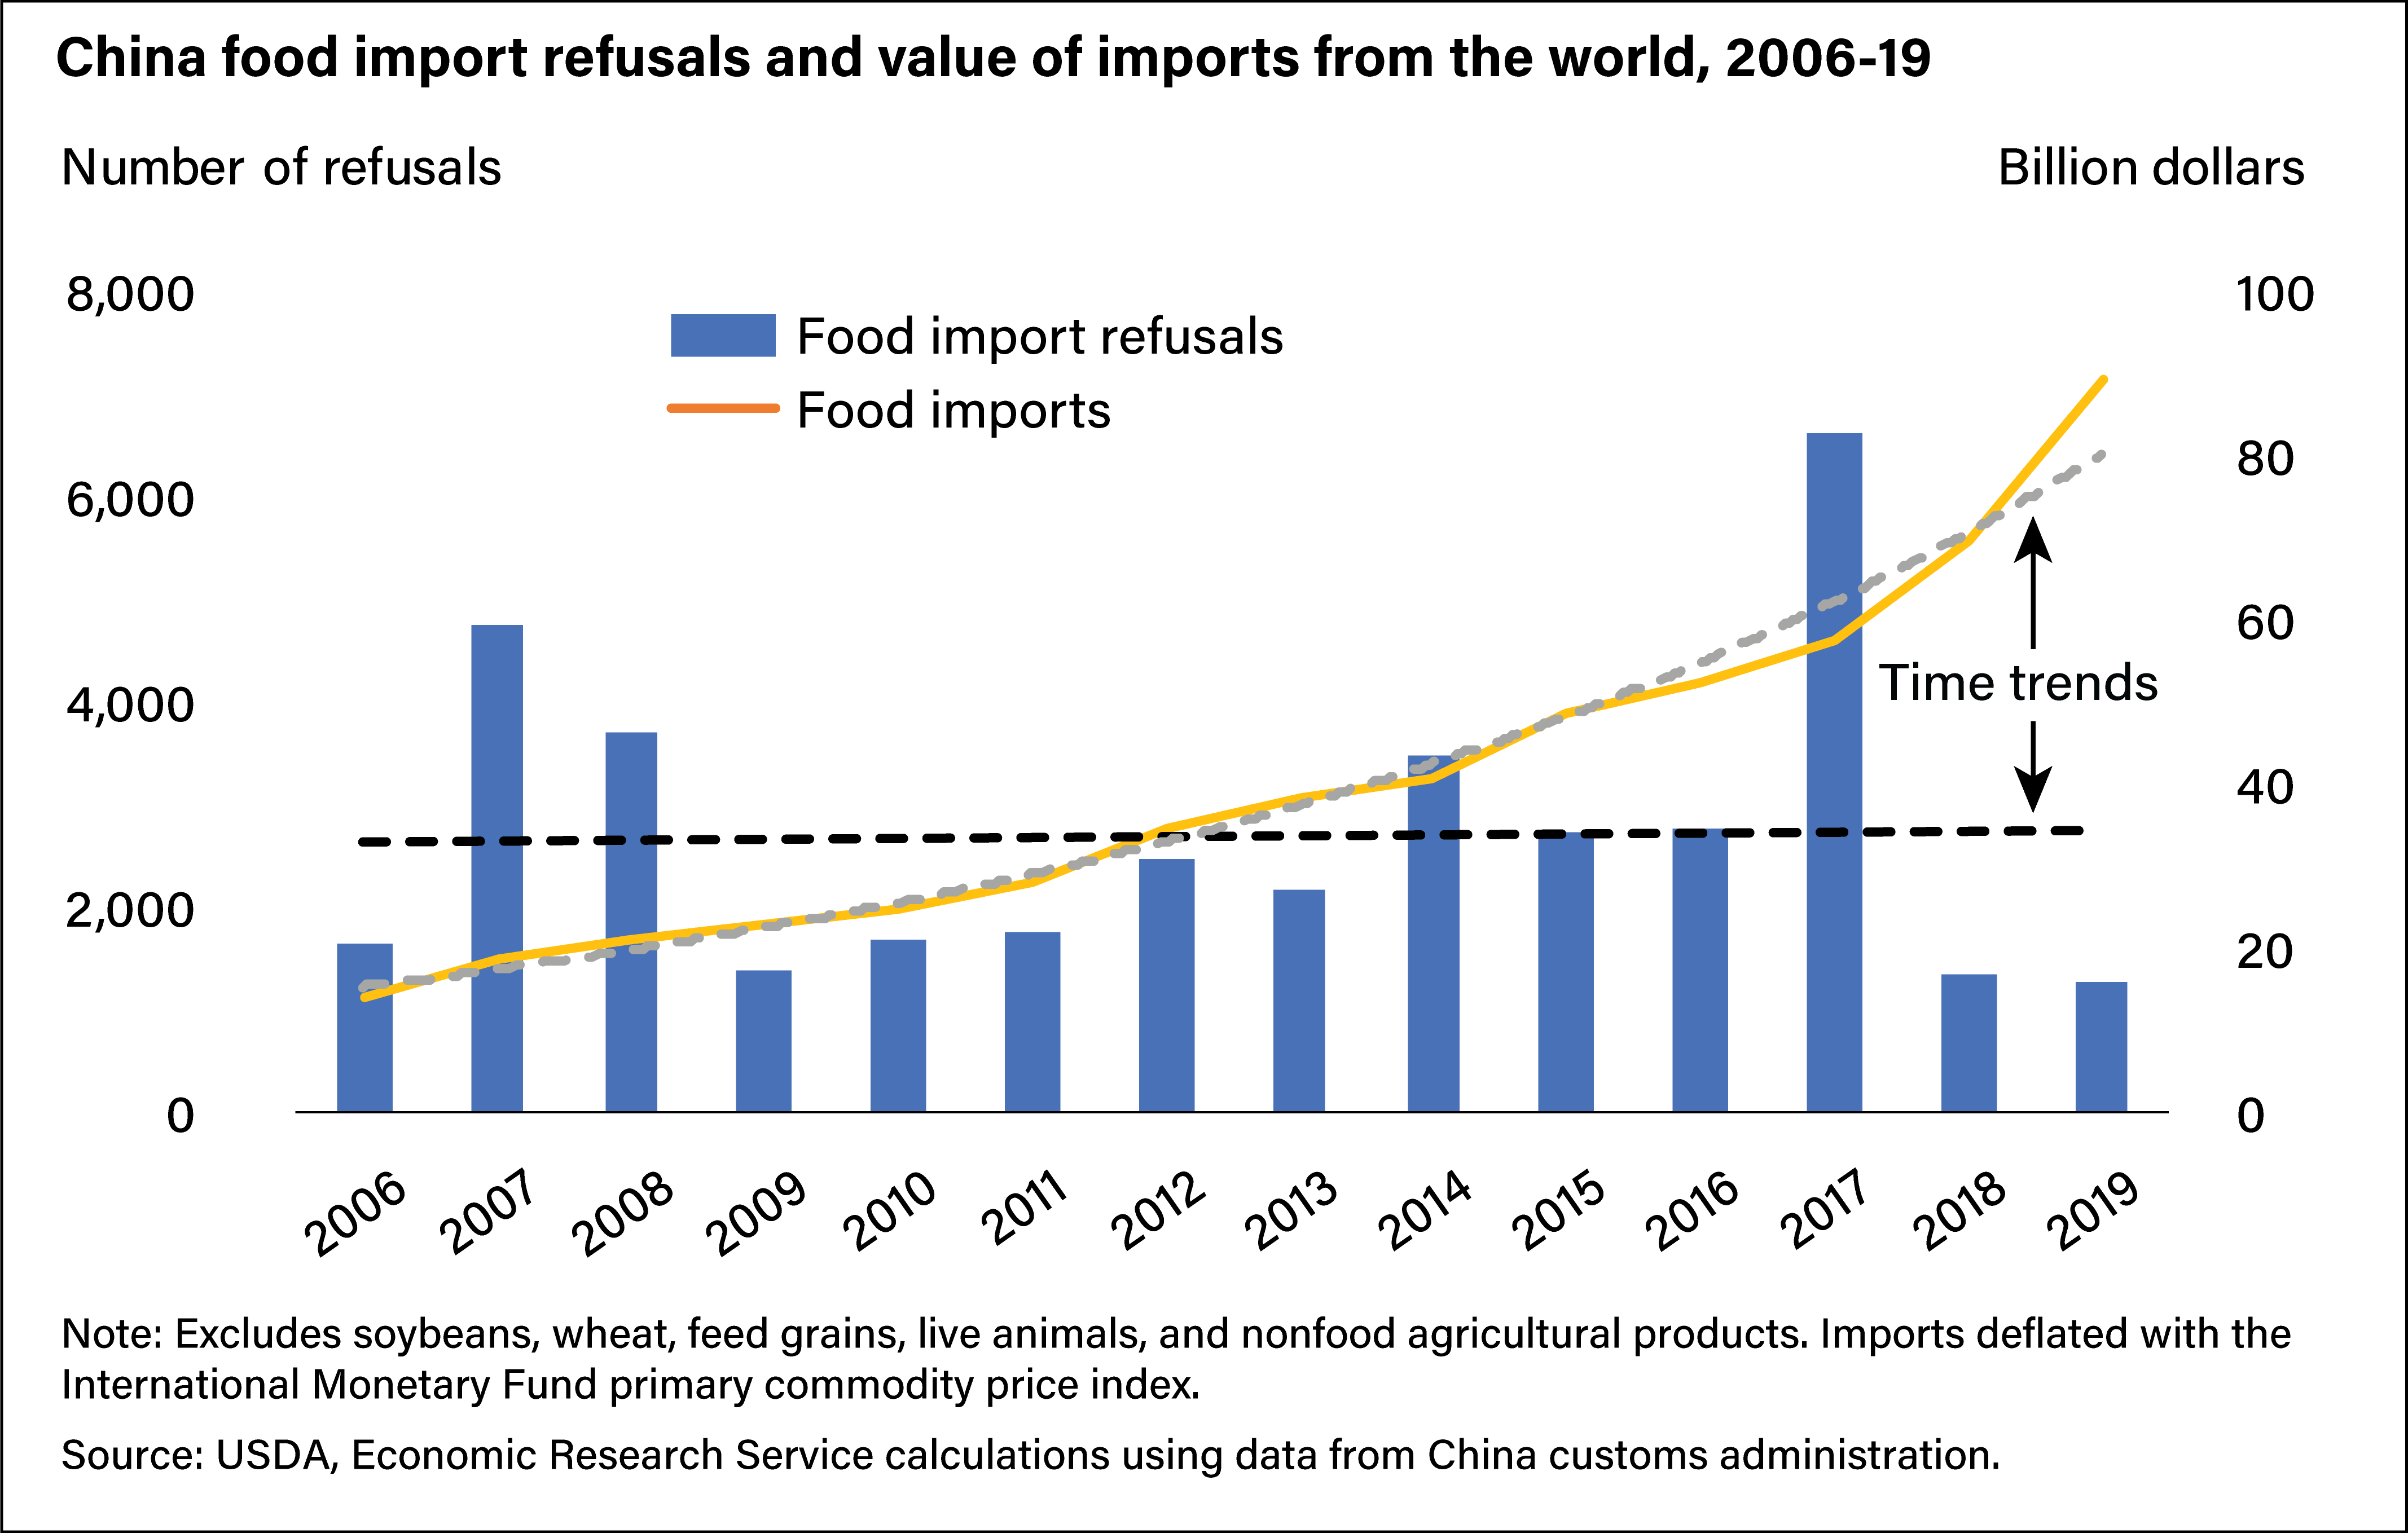
Chinese officials have introduced many new regulations and standards and food imports have boomed, but rejections have not kept up with the swelling volume of trade. China’s food imports rose from $14 billion to $89 billion during 2006-19—a 12-percent annual growth rate at constant prices. In contrast, researchers found no systemic trend in the average of 2,600 food shipments rejected annually (see chart below). Rejections rose as high as 6,600 shipments in 2017 but fell below the average in each of the most recent 3 years.
China does not reveal the total number of imported food shipments nor the number of inspections conducted, so there is no information to determine whether changes in the number of refusals reflect changes in the number of shipments or frequency of inspections. Food is one of many product categories customs authorities inspect, and news reports of campaigns against smuggling suggest personnel and other resources might have been shifted away from inspections at ports to other priorities in some years. A surge in food import refusals in 2017 coincided with reports and news articles focused on the safety of imported food that year. A reorganization of the Chinese government in 2018 that included customs and food inspection agencies could have contributed to the drop in refusals that year.
Processed Foods and Beverages Account for Most Refusals
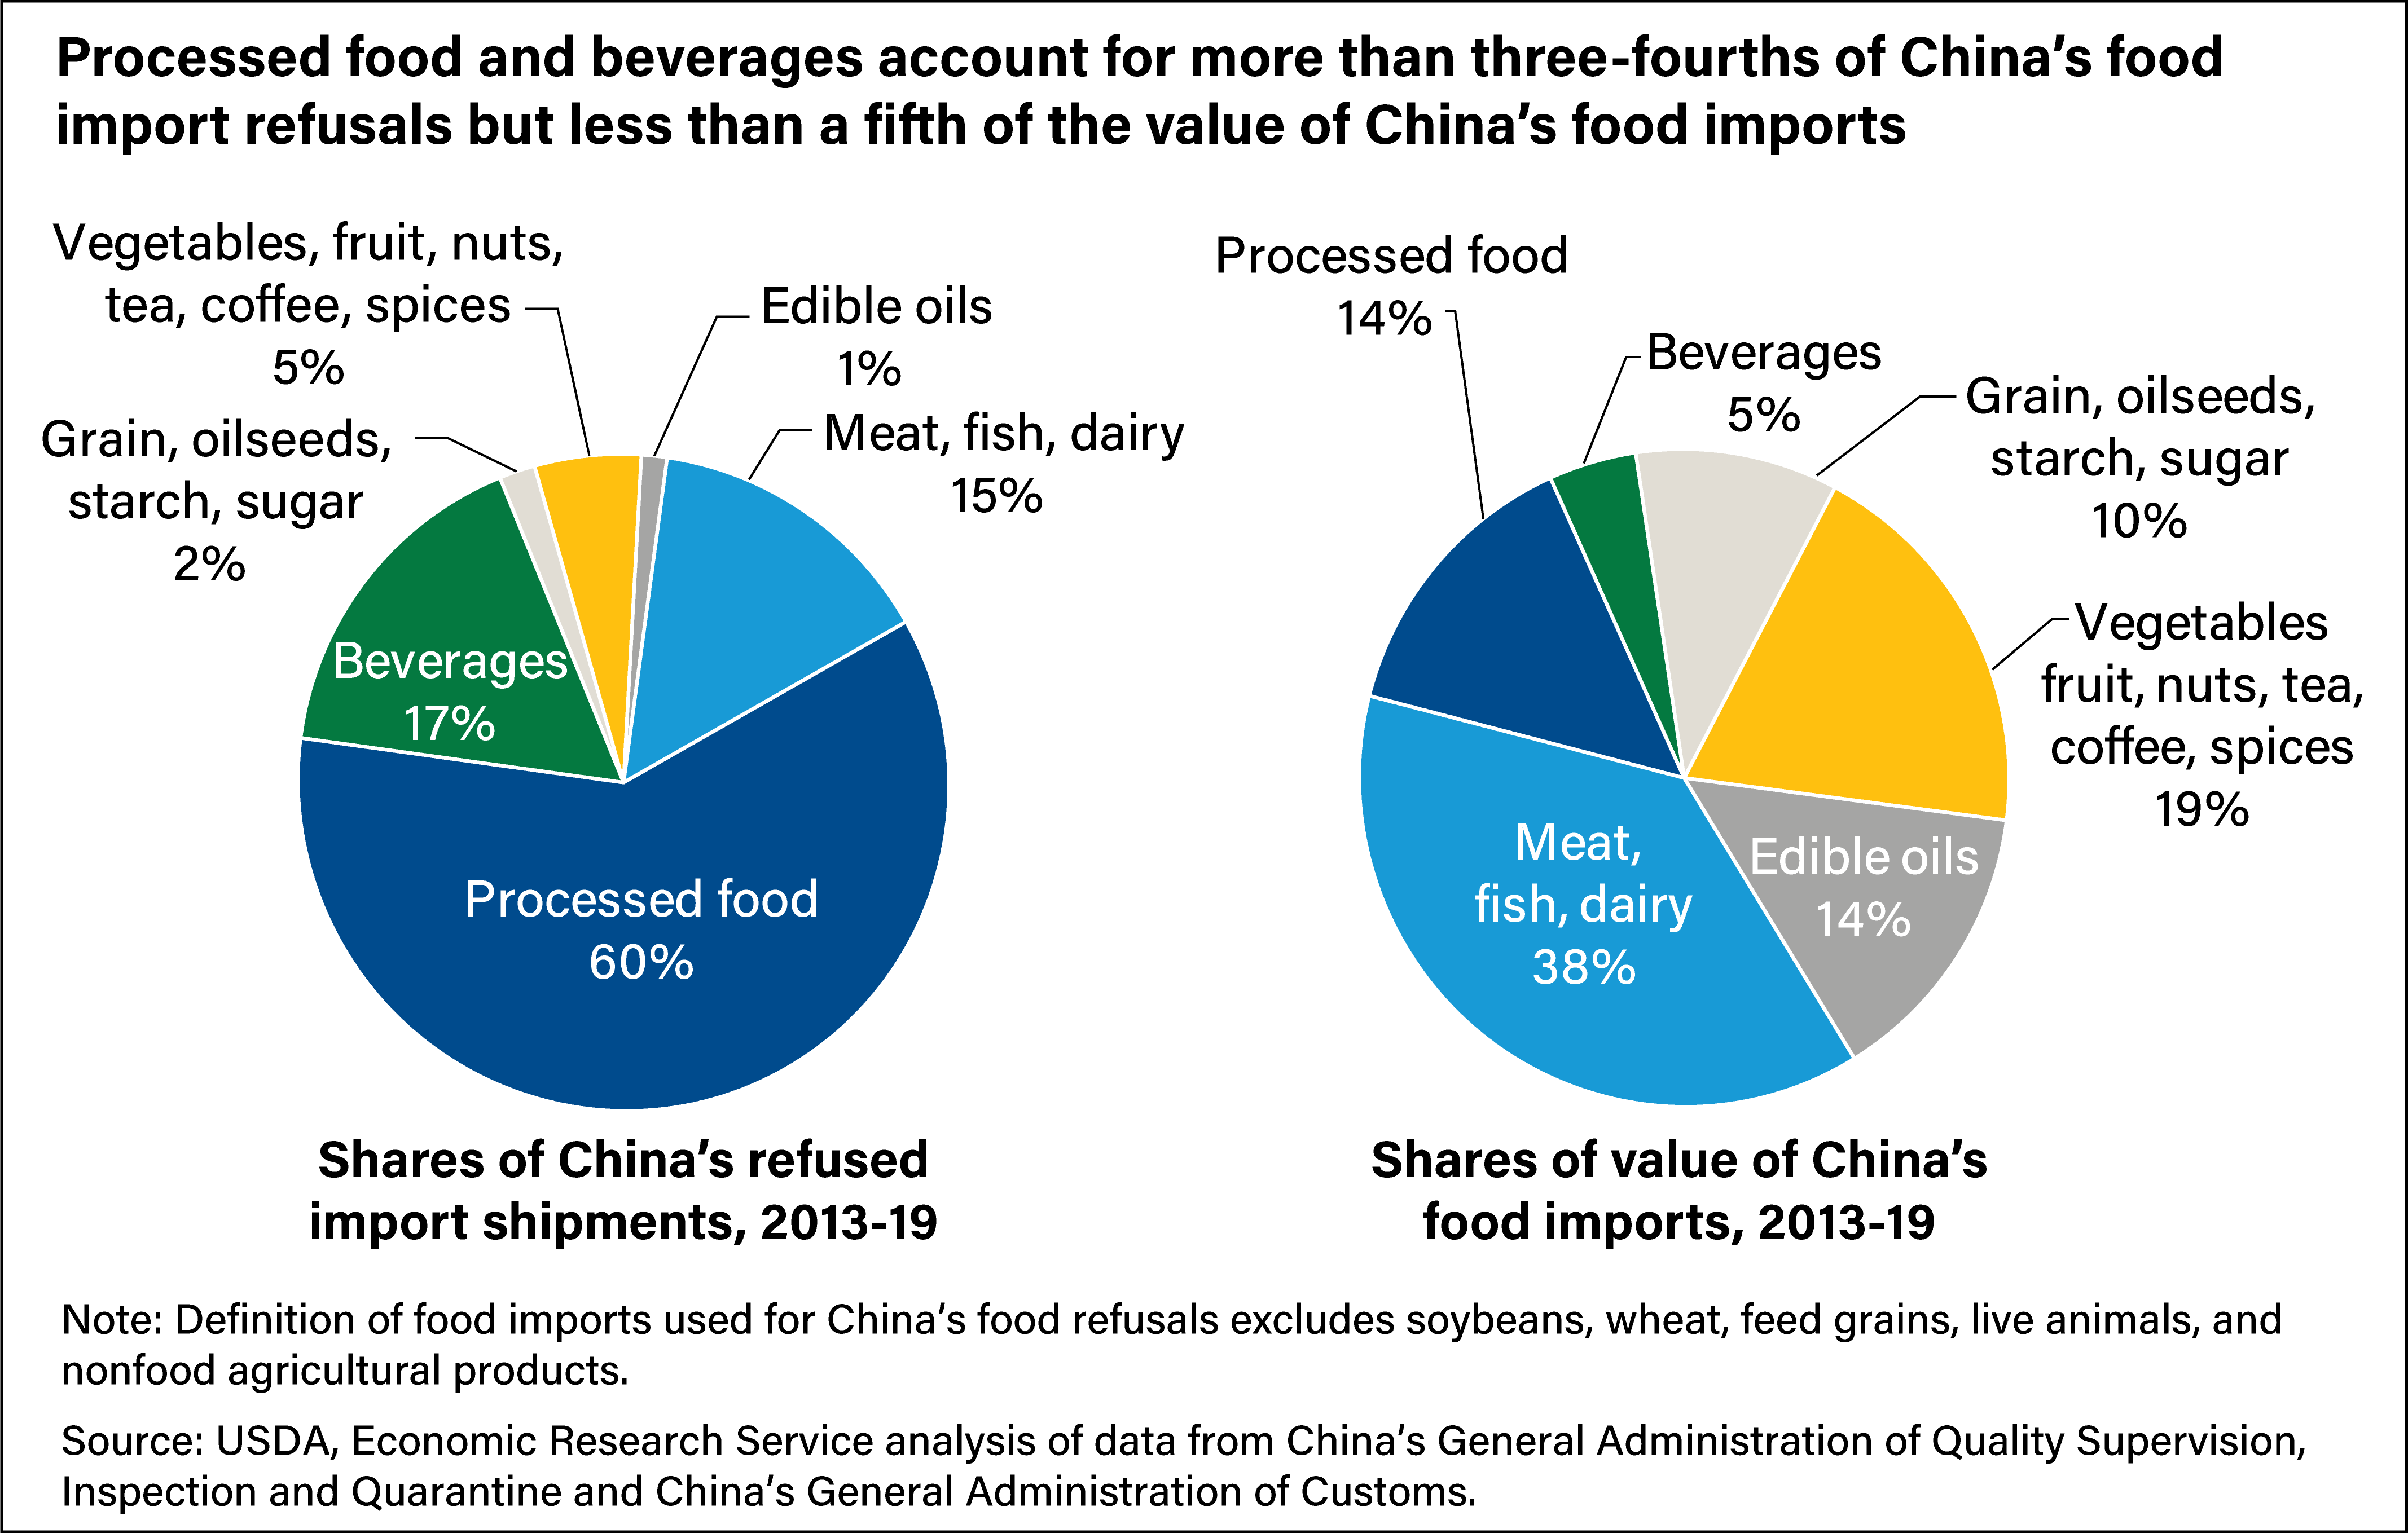
Rejected shipments included boxes of tea leaves, wine, and bird’s nests (for bird’s nest soup, a Chinese delicacy), as well as shipping containers holding hundreds of tons of vegetable oil, fruit, mineral water, and meat. ERS calculated rejection rates for major food categories with similar shipment sizes using the ratio of the weight of rejected shipments to the volume of imports (in metric tons). For example, China rejected an average of 1,238 metric tons of meat shipments each year during 2013-19, but that was just 0.033 percent of the country’s average volume of meat imports (3.75 million metric tons). Refusal rates were lowest for starch, sugar, fruit, and nuts—all were less than 0.01 percent of import volume. The sweetened beverages category showed higher refusal rates, at 0.4 percent, while tea, coffee, spices, prepared meat, chocolate, food preparations, and alcoholic beverages all came in at 0.1 to 0.2 percent.
Honey stands out as the only item with a refusal rate above 1 percent. China cited high bacteria counts, the addition of sugar, unspecified adulterants, and antibiotic residues in rejections of honey from countries such as New Zealand, the European Union (EU), Australia, and Thailand. However, China exports more honey than it imports, and international news media commonly identify China as a source of adulterated honey exported to the United States and Europe.
Consumer-ready items such as baked goods, pastries, snack foods, health supplements, drink mixes, candy, bottled water, wine, and other beverages not only have the highest refusal rates but also comprise the largest number of refused shipments. Processed foods and beverages together accounted for 77 percent of refused shipments during 2013-19, while accounting for only 19 percent of the value of China’s food imports.
U.S. Products Accounted for 7 Percent of Refusals
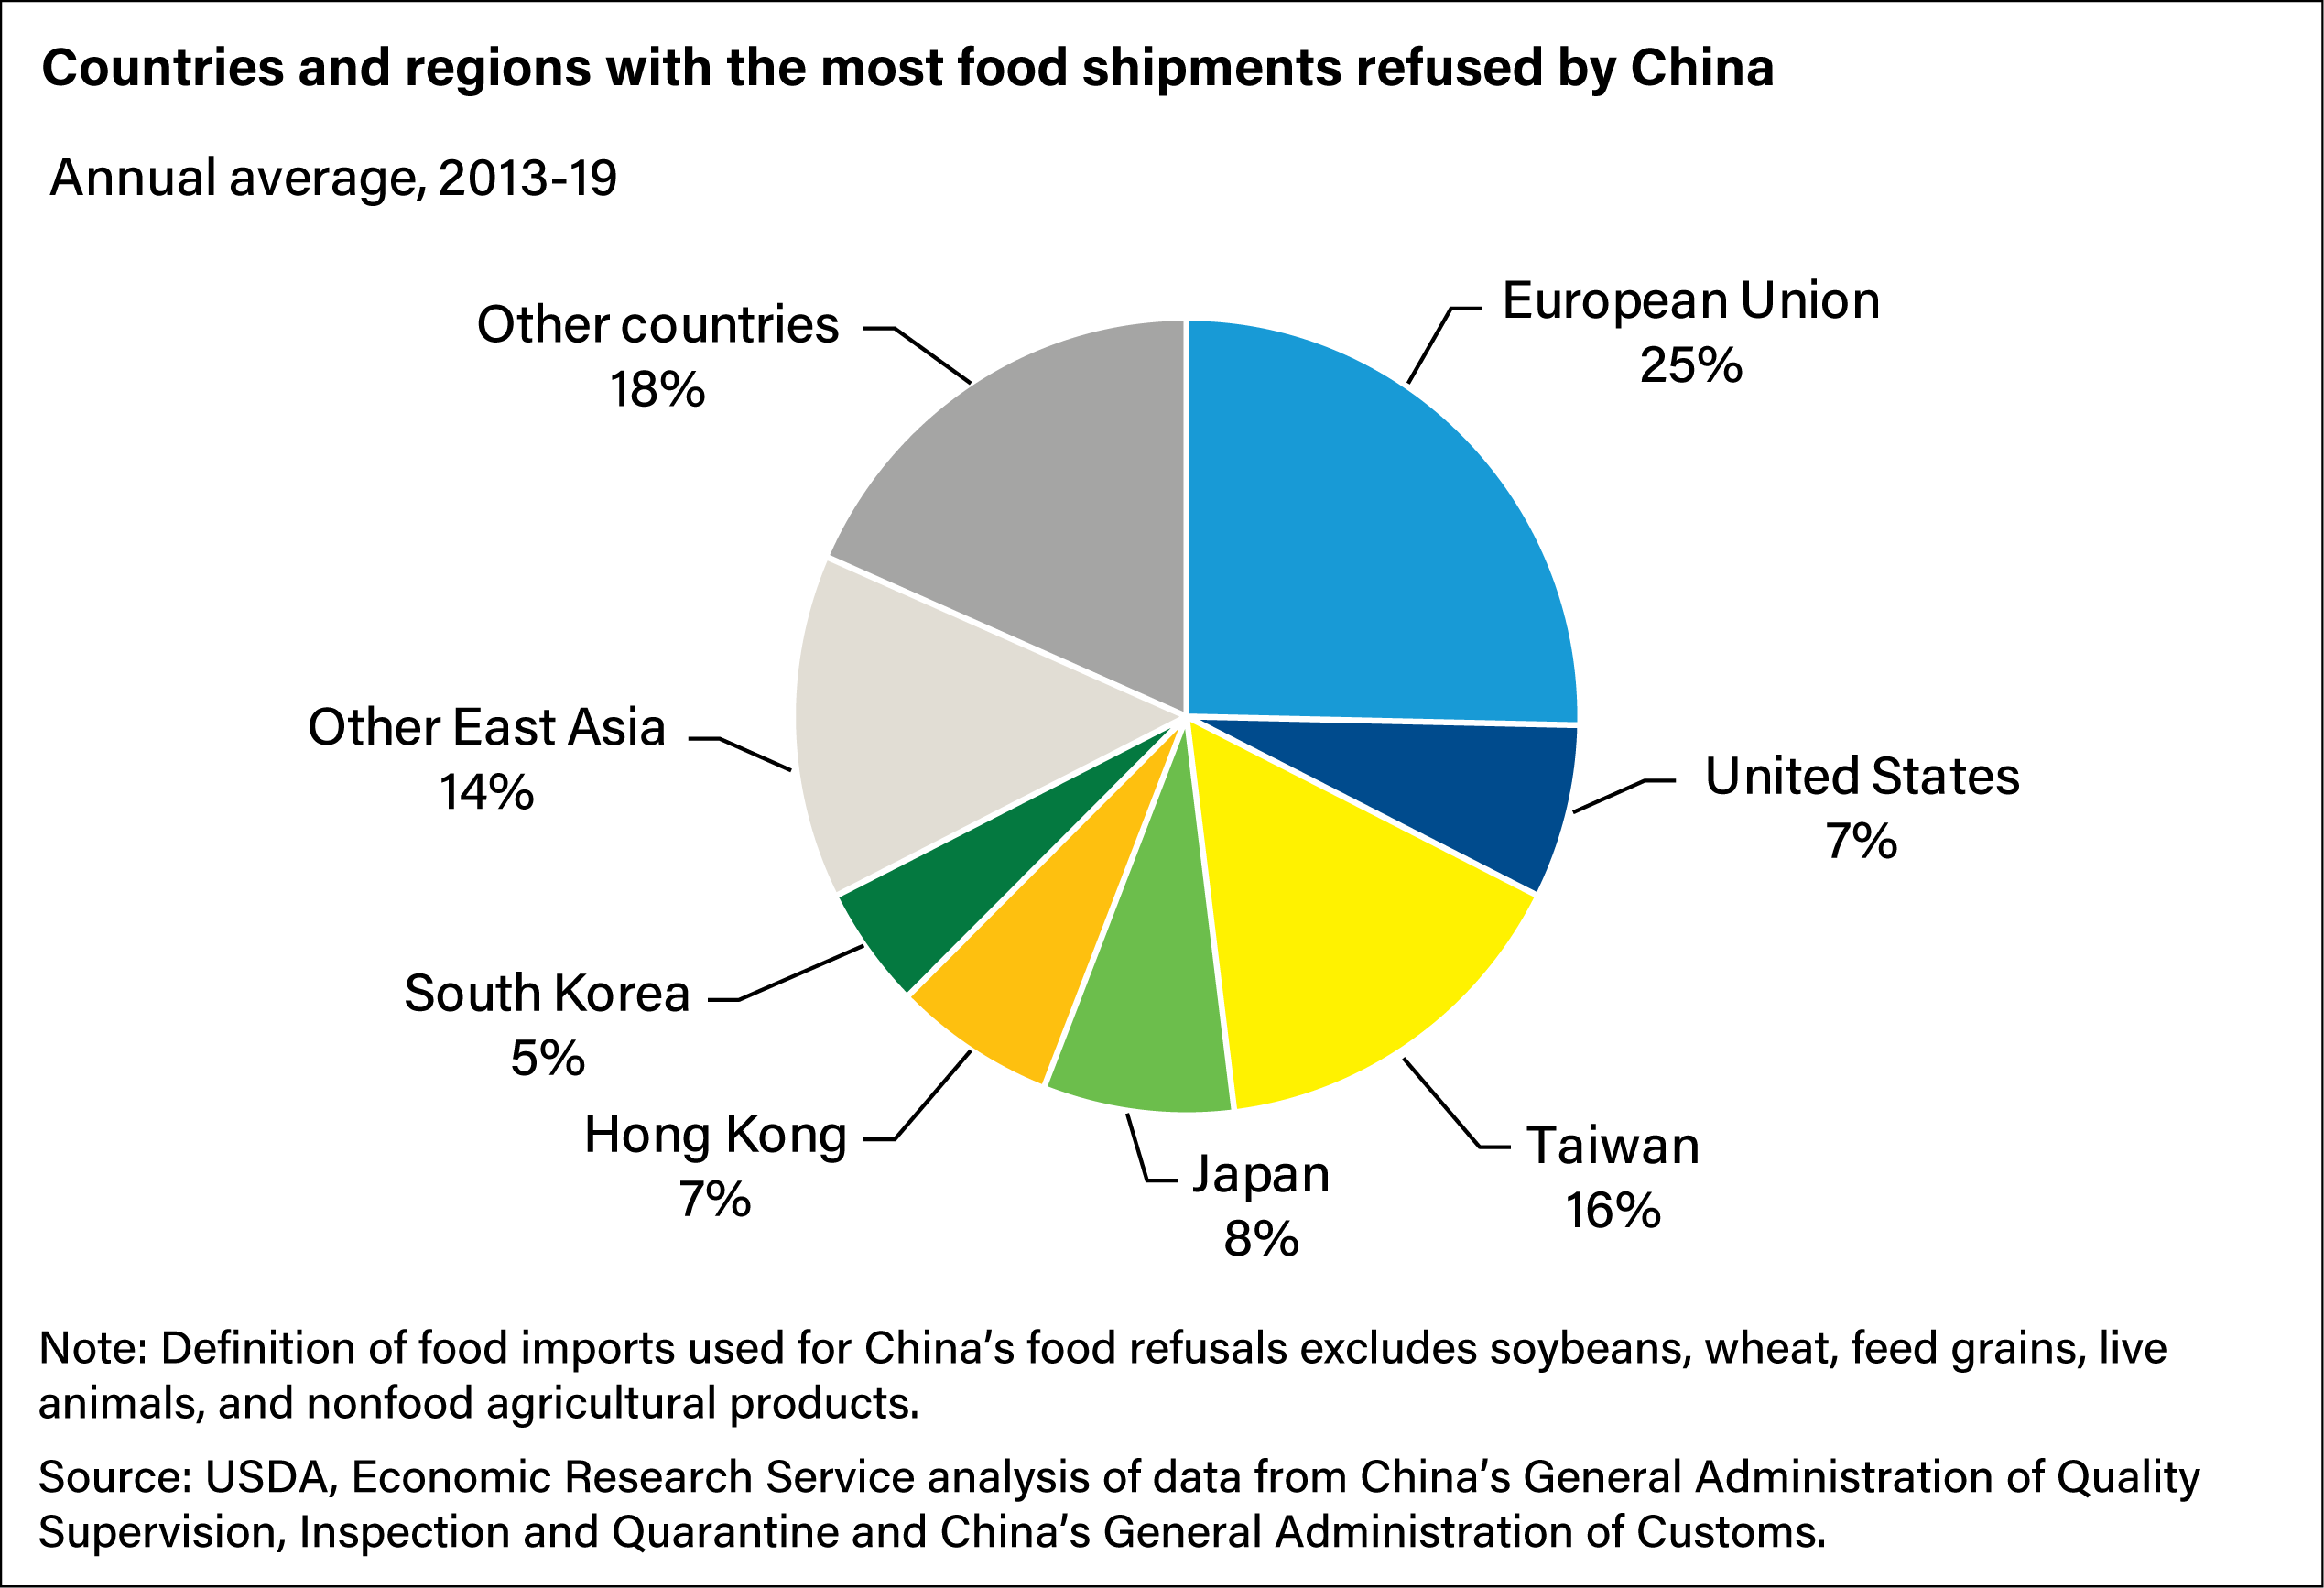
China refused food shipments from more than 100 countries and regions during 2013-19. The 27 EU countries combined had the largest number of annual refusals, accounting for a fourth of rejected shipments. The EU is the largest supplier of China’s imports of consumer-ready foods and wines, which tend to be refused with the highest frequency. The large number of EU rejections, therefore, seems to reflect the large volume of China-EU trade in these products.
U.S. products accounted for about 7 percent of refusals and 8 percent of food imports during 2013-19, indicating China refused U.S. foods at slightly less than the overall average. Like the EU, the United States exports many consumer-ready products. In contrast, New Zealand and Canada had relatively few shipments rejected because they supply China with items such as edible oils, canola, and dairy that tend to have low refusal rates.
China’s neighbors in Asia accounted for a disproportionately large share of refusals. Taiwan, Japan, South Korea, and Hong Kong accounted for 35 percent of refused shipments, although they accounted for just 4 percent of China’s food imports. Other Asian countries—Thailand, Malaysia, Vietnam, and Indonesia—were also among the leading suppliers of refused shipments.
Smaller Countries See Surge of Refusals in 2020
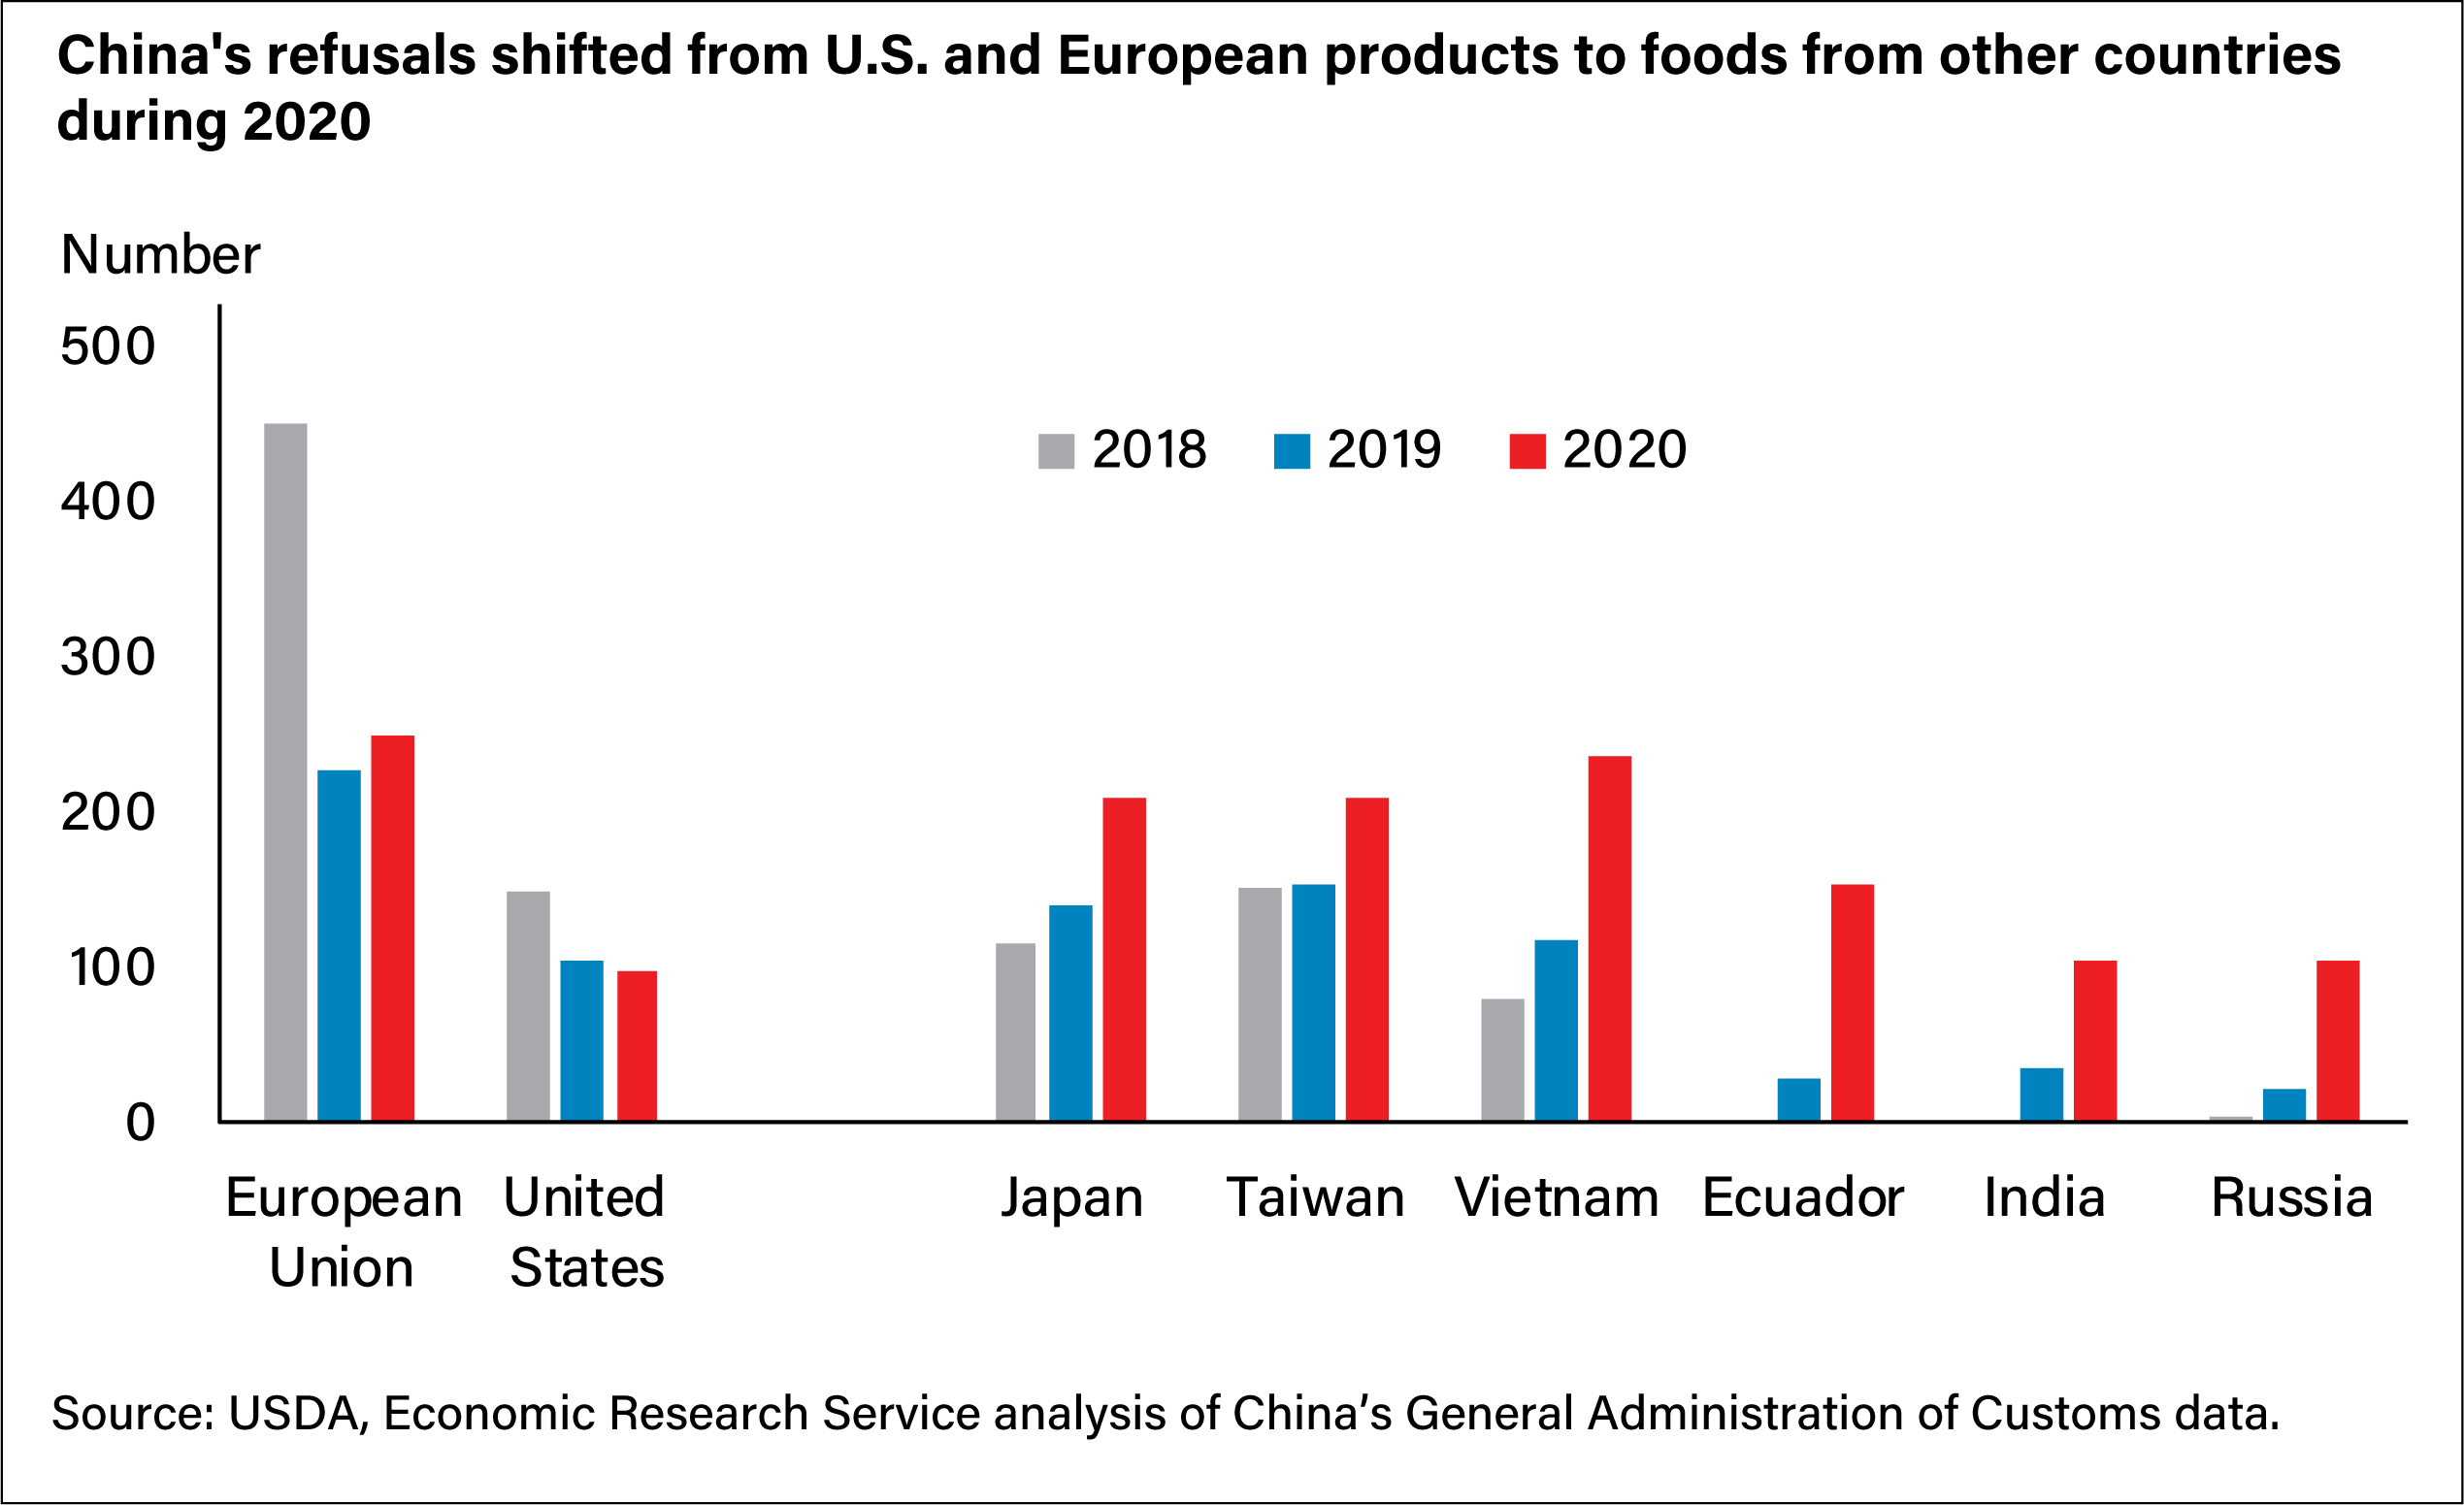
During 2020, Chinese inspectors appear to have shifted their attention from EU and U.S. food to a diverse group of other countries and regions. Refusals of EU and U.S. food shipments during 2020 were down from 2018 and less than half their 2013-19 averages (see chart below). The United States accounted for 5 percent of refusals in 2020, lower than its 7-percent share in past years. The EU’s share shrank to 12 percent in 2020. Australia, Canada, and New Zealand each had well under 100 shipments refused during 2020. China refused just 12 shipments from Canadian exporters in 2020.
In contrast, the number of rejected Vietnam shipments doubled from the previous year in 2020 and was nearly the same as the number of EU shipments refused. Ecuador had 155 shipments rejected in 2020 after having none in 2018. India and Russia each had 104 shipments turned back in 2020, even though both had 5 or fewer shipments refused in 2018. Taiwan and Japan were among the leading sources of refused shipments in past years, but they also had notable increases in the number of shipments refused in 2020. Vietnam, Ecuador, India, Russia, Taiwan, and Japan together accounted for half of rejected food shipments in 2020, much higher than their 28-percent share during 2013-19.
China’s concern about the transmission of coronavirus COVID-19 from the packaging of imported frozen food may have contributed to the increase in refusals from Ecuador, Vietnam, and India during 2020. Chinese regulators focused greater attention on imported seafood and meat during 2020 as the COVID-19 virus spread in countries that export these products to China. Chinese officials began widespread sanitation and testing of imported meat and seafood after a seafood counter in a wholesale market was linked to an outbreak in Beijing during June 2020. In December 2020, China’s market regulatory authority set up a system to sanitize shipments of imported frozen food at the border, track them as they moved to warehouses and markets throughout the country, and segregate them on separate shelves in retail stores. According to a February 2021 announcement by China’s customs administration, authorities tested 1.49 million samples taken from imported frozen food—mainly seafood and meat—with 79 positive COVID-19 results reported, found mostly on the outer packaging of shipments. China’s February 2021 customs announcement showed it had suspended imported foods from 129 exporters in 21 countries because of concerns about COVID-19 transmission. Among those were three Ecuadorean shrimp exporters suspended in July 2020 after Chinese inspectors found traces of the COVID-19 virus on the packaging and a shipping container shipped by the companies. Frozen shrimp accounted for all but two of Ecuador’s refusals in 2020. More than 20 shrimp shipments each from India and Vietnam were also refused. However, none of the refusals cited the COVID-19 virus. Instead, the refusals of shrimp from Ecuador and other countries cited “detection of animal disease,” a violation that had been reported regularly for rejections of shrimp before the COVID-19 pandemic’s onset. About 30 refused shipments of shrimp from Vietnam and some from India were also described as “South American shrimp,” suggesting the possibility that items had been transshipped to evade China’s suspension of Ecuadorean shrimp. However, the shrimp from Vietnam were cited for the use of phosphates as an additive, a violation unrelated to COVID-19.
Food shipment rejections for reasons not related to COVID-19 also rose in 2020. China turned down chili peppers and peanuts from Vietnam, citing labeling violations, foreign material, pesticide residues, filth, and mold. Inspectors said cumin seeds from India were contaminated with pesticides, and Indian chili peppers were cited for mold. Russian shipments of chicken paws were reported to be degraded or spoiled, and beef was refused for lacking proper labels. The most frequently cited violations for Japanese and Taiwanese products were lack of documentation, inconsistencies in documents, lack of inspections, and problems with labels.
Many food exporters see potential profit in China’s growing market, but exporters also face potential risk when shipments are rejected for violating Chinese regulations. While rejections are relatively infrequent and have not kept up with the rapid growth in trade, they can be costly to exporters when they do occur. The number of rejections occasionally spikes during crackdowns and other unexpected events, such as China’s concerns about transmission of COVID-19 on imported food packaging. These rejections provide useful information for commercial actors and policymakers who are watching China’s growing role in global food markets.
This article is drawn from:
- Gale, F. (2021). China's Refusals of Food Imports. U.S. Department of Agriculture, Economic Research Service. ERR-286.
You may also like:
- Bovay, J. (2016). FDA Refusals of Imported Food Products by Country and Category, 2005-2013. U.S. Department of Agriculture, Economic Research Service. EIB-151.
- Gale, F. & Buzby, J.C. (2009). Imports From China and Food Safety Issues. U.S. Department of Agriculture, Economic Research Service. EIB-52.
- Arita, S., Gale, F. & Mao, X. (2017). Food Safety and International Trade: Regulatory Challenges. Food Safety in China: Science, Technology, Management and Regulation. edited by J. Jen and J. Chen, Wiley..
- Gale, F. & Hoffman, S. (2017). Lessons for China from US Food Safety History. Food Safety in China: Science, Technology, Management and Regulation. edited by J. Jen and J. Chen, Wiley..


